Number lines
The film's code
import manimgx as m


class NumberLinesHero(m.Scene):
    def construct(self) -> None:
        line = m.NumberLine(x_range=[-3, 3, 1], length=10, include_numbers=True)
        dot = m.Dot(line.n2p(-2), radius=0.12, color=m.YELLOW)
        interval = m.UnitInterval(length=8, include_numbers=True).shift(2 * m.DOWN)
        self.play(m.Create(line))
        self.play(m.GrowFromCenter(dot))
        self.play(dot.animate.move_to(line.n2p(2.5)), run_time=2)
        self.play(m.Create(interval))
        self.wait()
A number line is a line with a number at each of its points. Its range, [start, end,
step], gives its first and last numbers and the step between its ticks; its length is in
the frame's units. n2p turns a number into its point
on the line, to put anything at a number.
Axes are number lines too: each axis of Axes is one, and takes the keywords below.
NumberLine 
Code
import manimgx as m


class NumberLineExample(m.Scene):
    def construct(self) -> None:
        lines = m.VGroup(
            m.NumberLine(x_range=[-5, 5, 1], length=12, include_numbers=True),
            m.NumberLine(
                x_range=[0, 2, 0.25],
                length=12,
                include_numbers=True,
                font_size=28,
                color=m.BLUE,
            ),
            m.NumberLine(
                x_range=[-10, 10, 2],
                length=12,
                numbers_with_elongated_ticks=[-10, 0, 10],
                include_tip=True,
                include_numbers=True,
                label_direction=m.UP,
                color=m.YELLOW,
            ),
        ).arrange(m.DOWN, buff=1)
        self.add(lines)
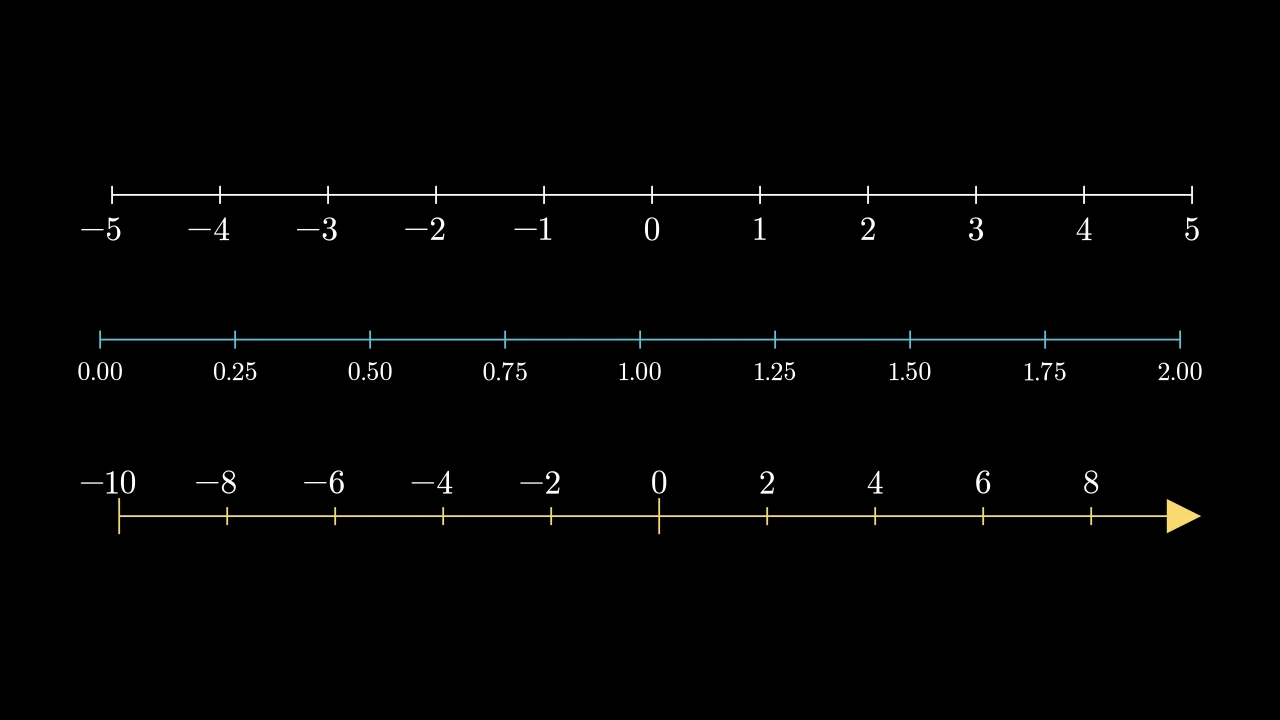
A number line: a line with ticks at every step of its range, numbers if asked for, and a map between numbers and points; white, with a stroke 2 wide, unless styled.
Its range, [x_min, x_max, x_step], runs from its left end to its right end: the
line is length long, in scene units, or unit_size per unit, and it is centered
on the scene's origin (then turned through rotation). Its ticks are x_step
apart, counted from 0 when the range contains it (from x_min otherwise); a tip at
its end takes the place of the last tick.
number_to_point and
point_to_number convert between numbers and
points; add_numbers and
add_labels write on it. A scaling spaces the
numbers otherwise: with LogBase, the range is of exponents, and
the line's numbers are powers.
Initial length, rotation, tip dimensions and which ticks/numbers to draw are construction inputs, not retained attributes. The line keeps its drawing and the defaults used by later tick and label methods; the numbers to exclude and those with elongated ticks are kept as the lists they were when it was made.
m.NumberLine(x_range=None, length=None, unit_size=1, include_ticks=True, tick_size=0.1, numbers_with_elongated_ticks=None, longer_tick_multiple=2, exclude_origin_tick=False, rotation=0, include_tip=False, tip_width=DEFAULT_ARROW_TIP_LENGTH, tip_height=DEFAULT_ARROW_TIP_LENGTH, tip_shape=None, include_numbers=False, font_size=36, label_direction=DOWN, label_constructor=MathTex, scaling=_AXIS_LINEAR, line_to_number_buff=MED_SMALL_BUFF, decimal_number_config=None, numbers_to_exclude=None, numbers_to_include=None, **kwargs)
x_rangeThe range,
[x_min, x_max, x_step], or[x_min, x_max]for a step of 1; None for [-7, 7, 1].lengthThe line's length, in scene units; None for
unit_sizeper unit.unit_sizeThe length of one unit, in scene units, when
lengthis None.include_ticksWhether to draw the ticks.
tick_sizeHow far each tick reaches on either side of the line, in scene units: half its length.
numbers_with_elongated_ticksThe numbers whose ticks are longer; None for none.
longer_tick_multipleHow many times longer those ticks are.
exclude_origin_tickWhether to leave out the tick at 0.
rotationThe angle the line is turned through about its center, in radians, counterclockwise.
include_tipWhether the line ends in an arrow tip, at its end.
tip_widthThe tip's width, in scene units.
tip_heightThe tip's length, along the line, in scene units.
tip_shapeThe class of the tip; None for ArrowTriangleFilledTip.
include_numbersWhether to number the ticks (see add_numbers).
font_sizeThe numbers' font size.
label_directionThe side of the line the numbers go on, as a direction: DOWN for below.
label_constructorThe class the numbers and labels are typeset with: MathTex, MathTypst, ….
scalingHow numbers are spaced along the line: evenly, with LinearBase, or by their logarithms, with LogBase (its numbers are then written as powers).
line_to_number_buffThe gap between the line and its numbers, in scene units.
decimal_number_configThe numbers' number keywords; None for as many decimal places as
x_stephas.numbers_to_excludeNumbers not to write, when the ticks are numbered; None for none.
numbers_to_includeThe numbers to write, instead of the ticks': given, they are written even without
include_numbers. None for the ticks'.colorThe color of both fill and stroke (default white; a Circle's is red); None for the class's default.
tip_lengthThe length of the tips add_tip makes, in scene units (default 0.35; an Arrow's may be shorter).
normal_vectorThe normal of the plane the path lies in (default OUT). Accepted for Manim compatibility; ignored and not retained.
tip_styleStyle keywords for the tips the path makes (default None: none). A tip's
fill_colorandstroke_colorare the path's color unless given here.fill_colorThe fill's color;
colorif not given. Several colors make a gradient alongsheen_direction.fill_opacityThe fill's opacity, from 0 to 1 (default 0: no fill).
stroke_colorThe stroke's color;
colorif not given. Several colors make a gradient.stroke_opacityThe stroke's opacity, from 0 to 1 (default 1).
stroke_widthThe stroke's width, in hundredths of a scene unit (default 4; 0: no stroke).
background_stroke_colorThe color of an outline drawn behind the fill (default black).
background_stroke_opacityThe outline's opacity, from 0 to 1 (default 1).
background_stroke_widthThe outline's width, in hundredths of a scene unit (default 0: none).
sheen_factorHow much the colors lighten toward
sheen_direction, from -1 to 1 (default 0); a negative factor darkens.sheen_directionThe direction the colors lighten toward (default
UL).joint_typeHow the stroke is joined where its path turns: round, beveled or mitered, as a two-dimensional scene draws it (see LineJointType; default AUTO: mitered).
cap_styleHow the stroke ends, at each end it shows (an open path's, a dash's): round, butt or square, as a two-dimensional scene draws it (see CapStyleType; default AUTO: butt).
shade_in_3dWhether a three-dimensional scene's light shades the mobject.
materialHow its surface reflects the scene's lights in a three-dimensional scene (see Material); None: Manim's shading (default).
nameA name for the mobject; its class's name if not given.
z_indexIts place in the drawing order: a higher index is drawn over a lower one (default 0).
targetThe state
MoveToTargetmoves the mobject to.
It also takes the tip keywords.
Source
src/manimgx/mobjects/plotting.py
832 833 834 835 836 837 838 839 840 841 842 843 844 845 846 847 848 849 850 851 852 853 854 855 856 857 858 859 860 861 862 863 864 865 866 867 868 869 870 871 872 873 874 875 876 877 878 879 880 881 882 883 884 885 886 887 888 889 890 891 892 893 894 895 896 897 898 899 900 901 902 903 904 905 906 907 908 909 910 911 912 913 914 915 916 917 918 919 920 921 922 923 924 925 926 927 928 929 930 931 932 933 934 935 936 | |
x_range 
The line's range, [x_min, x_max, x_step], as given: of exponents, on a
logarithmic line.
x_min 
The line's number at its start: the first of its range, scaled (10⁰ = 1 for a range from 0, on a logarithmic line).
x_max 
The line's number at its end: the second of its range, scaled.
x_step 
The step of its range, scaled.
unit_size 
The length of one unit, in scene units, as the line was made; see get_unit_size for its length now.
scaling 
How the line's numbers are spaced along it.
rotate_about_zero 
Turn the line about the point of its number 0.
number_line.rotate_about_zero(angle, axis=OUT)
angleThe angle, in radians, counterclockwise about
axis.axisThe axis of the turn: OUT turns it in the plane of the screen.
Source
src/manimgx/mobjects/plotting.py
rotate_about_number 
Turn the line about the point of one of its numbers.
number_line.rotate_about_number(number, angle, axis=OUT)
numberThe number whose point stays fixed.
angleThe angle, in radians, counterclockwise about
axis.axisThe axis of the turn: OUT turns it in the plane of the screen.
Source
src/manimgx/mobjects/plotting.py
number_to_point 
Convert a number to its point on the line, or numbers to their points.
A number outside the range is on the line extended past its ends.
numberThe number; or an array of numbers, of any shape.
Returns The point, in scene coordinates; for an array, the points, with the coordinates last (the array's shape, then 3).
Source
src/manimgx/mobjects/plotting.py
point_to_number 
Convert a point to the number at its projection on the line: the inverse of number_to_point for points on the line.
pointThe point, in scene coordinates.
Source
src/manimgx/mobjects/plotting.py
n2p 
Convert a number to its point on the line: number_to_point, by a shorter name.
numberThe number; or an array of numbers, of any shape.
Returns The point, in scene coordinates; or the points.
Source
src/manimgx/mobjects/plotting.py
get_unit_size 
The length of one unit of the line: its length over its range.
Returns The length, in scene units (of one unit of exponent, on a logarithmic line).
Source
src/manimgx/mobjects/plotting.py
get_unit_vector 
The line's direction, one unit long: the vector from its start toward its
end, as long as the unit the line was made with (its unit_size).
Returns The vector, in scene units.
Source
src/manimgx/mobjects/plotting.py
get_number_mobject 
Make a number, written beside its point on the line.
It is a DecimalNumber in the line's number style (its
decimal_number_config and font_size), with number_config over it. A
negative number written straight below or above the line is shifted so its
digits, not its minus sign, are centered on the point.
xThe number.
directionThe side of the line it goes on; None for the line's
label_direction.buffThe gap between the line and the number, in scene units; None for the line's
line_to_number_buff.label_constructorThe class it is typeset with; None for the line's.
It also takes
the DecimalNumber keywords.
Returns A new number, not added to the line.
Source
src/manimgx/mobjects/plotting.py
add_numbers 
Code
import manimgx as m


class NumberLineAddNumbersExample(m.Scene):
    def construct(self) -> None:
        ticks = m.NumberLine(x_range=[0, 10, 1], length=12).add_numbers()
        chosen = m.NumberLine(x_range=[0, 10, 1], length=12, color=m.BLUE)
        chosen.add_numbers(
            [0, 2.5, 5, 7.5, 10], num_decimal_places=1, color=m.BLUE
        )
        self.add(m.VGroup(ticks, chosen).arrange(m.DOWN, buff=1.5))
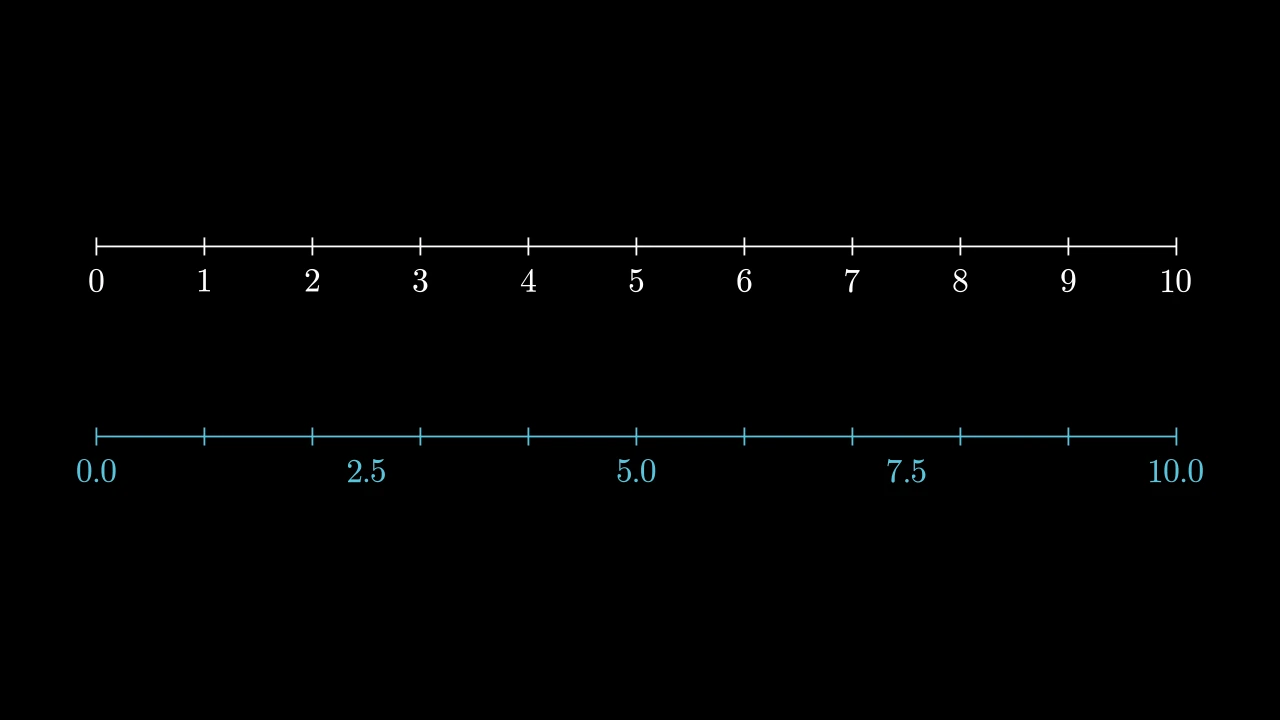
Number the line: write numbers beside the points of the given values, or of its ticks.
Each number is written as
get_number_mobject writes it. The
numbers are a group added to the line, and kept as its numbers.
x_valuesThe numbers to write; None for the ticks' numbers.
excludingNumbers not to write; None for the line's
numbers_to_exclude.label_constructorThe class they are typeset with; None for the line's.
It also takes
the DecimalNumber keywords.
Source
src/manimgx/mobjects/plotting.py
add_labels 
Code
import manimgx as m


class NumberLineAddLabelsExample(m.Scene):
    def construct(self) -> None:
        line = m.NumberLine(x_range=[0, m.TAU, m.PI / 2], length=12)
        line.add_labels(
            {
                0: "0",
                m.PI / 2: m.MathTex(r"\frac{\pi}{2}"),
                m.PI: m.MathTex(r"\pi"),
                3 * m.PI / 2: m.MathTex(r"\frac{3\pi}{2}"),
                m.TAU: m.MathTex(r"2\pi"),
            },
            font_size=44,
        )
        self.add(line)
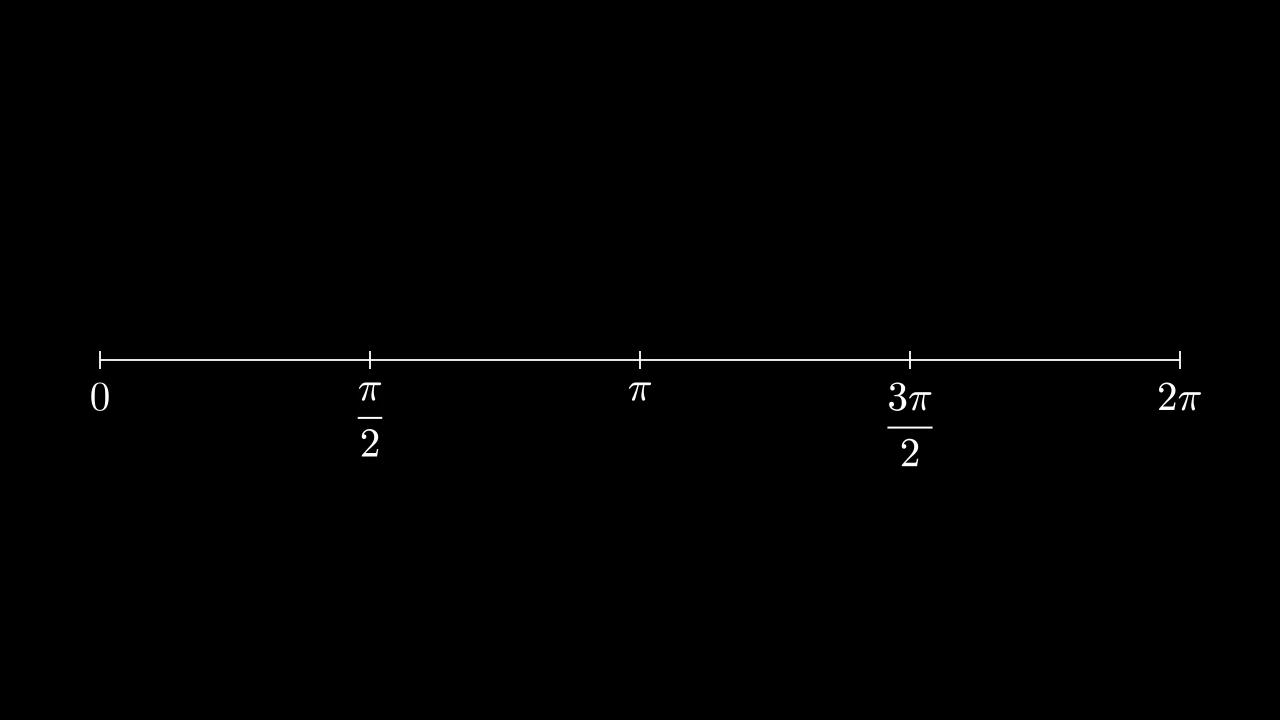
Label the line: put each label beside the point of its number.
A string is typeset as text with Tex when the constructor is
MathTex (as by default), and with the constructor otherwise;
a number is written with the constructor. A mobject is used as it is, and must
be typeset (a Typst mobject: Text,
Tex, MathTex, …) or a
DecimalNumber: another raises an exception. Every label
is set to font_size. The labels are a group added to the line, and kept as its
labels.
dict_valuesThe labels, by number.
directionThe side of the line they go on, as a direction; None for the line's
label_direction.buffThe gap between the line and the labels, in scene units; None for the line's
line_to_number_buff.font_sizeThe labels' font size; None for the line's.
label_constructorThe class strings and numbers are typeset with; None for the line's.
Source
src/manimgx/mobjects/plotting.py
1204 1205 1206 1207 1208 1209 1210 1211 1212 1213 1214 1215 1216 1217 1218 1219 1220 1221 1222 1223 1224 1225 1226 1227 1228 1229 1230 1231 1232 1233 1234 1235 1236 1237 1238 1239 1240 1241 1242 1243 1244 1245 1246 1247 1248 1249 1250 1251 1252 1253 1254 1255 1256 1257 1258 1259 1260 1261 1262 1263 1264 1265 1266 1267 1268 1269 1270 1271 1272 1273 1274 1275 1276 1277 | |
UnitInterval 
The unit interval: a number line from 0 to 1, with a tick every tenth; 10 units long, its ticks at 0 and 1 longer, unless told otherwise.
Its numbers, when it has them, have one decimal place.
It also takes
the NumberLine keywords.
Source
src/manimgx/mobjects/plotting.py
Scales
A line's scale places its numbers: evenly, or by their logarithms. Give it as scaling.
LinearBase 
Code
import manimgx as m


class LinearBaseExample(m.Scene):
    def construct(self) -> None:
        plain = m.NumberLine(
            x_range=[-3, 3, 1], length=10, include_numbers=True
        )
        doubled = m.NumberLine(
            x_range=[-3, 3, 1],
            length=10,
            include_numbers=True,
            scaling=m.LinearBase(scale_factor=2),
            color=m.BLUE,
        )
        self.add(m.VGroup(plain, doubled).arrange(m.DOWN, buff=1.5))
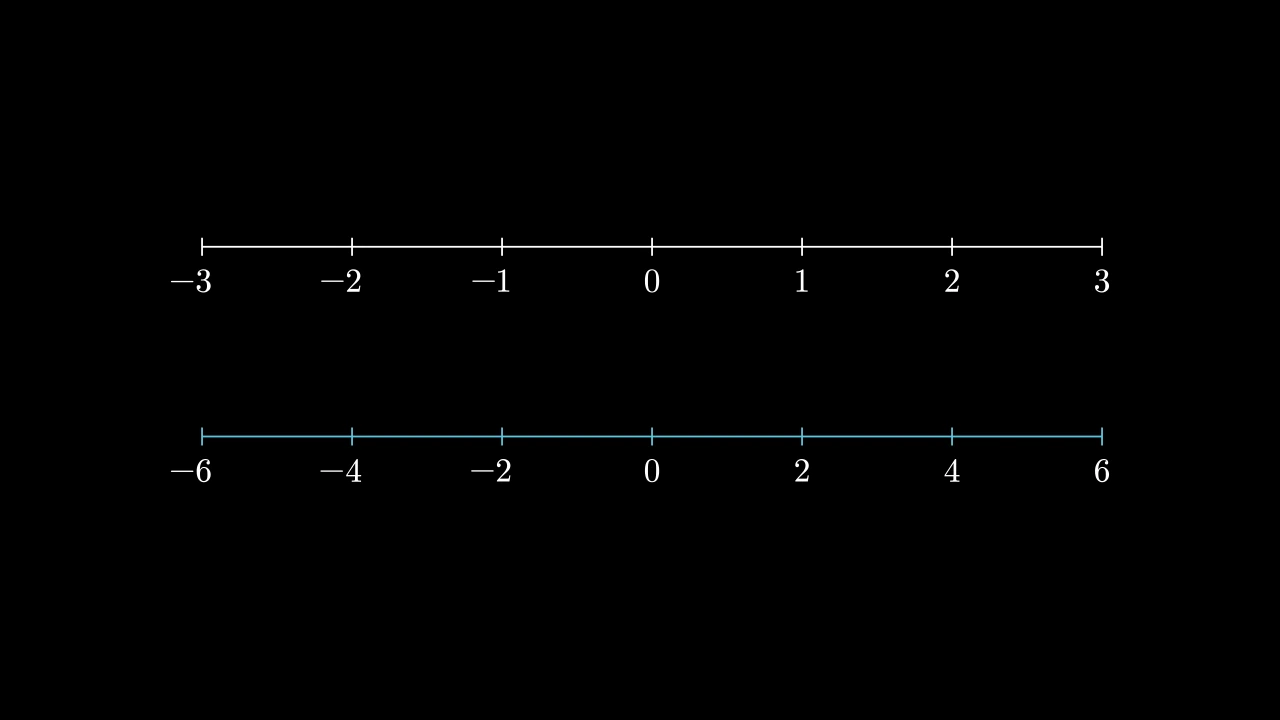
An even scale for a number line: its numbers evenly spaced along it, the numbers
of its range times scale_factor.
It is a number line's default scale, and with a factor of 1 its numbers are those of
its range. With another factor, the line keeps its length and its ticks, and its
numbers are multiplied: with 2, a range [-2, 2, 1] is numbered from -4 to 4 in
steps of 2, and n2p places 4 at its end. Give it as a
number line's scaling, or an axis's in an axis config.
scale_factorThe factor from the numbers of the range to the numbers of the line.
Source
src/manimgx/mobjects/plotting.py
scale_factor 
The factor from the numbers of the range to the numbers of the line.
function 
The number of the axis at a value of its range: 10² for 2, on a logarithmic axis.
valueThe value of the range; or an array of values.
Returns The number; or the numbers, an array of the same shape.
Source
src/manimgx/mobjects/plotting.py
inverse_function 
The value of the axis's range at one of its numbers: 2 for 100, on a
logarithmic axis; the inverse of function.
valueThe number; or an array of numbers.
Returns The value of the range; or the values, an array of the same shape.
Source
src/manimgx/mobjects/plotting.py
LogBase 
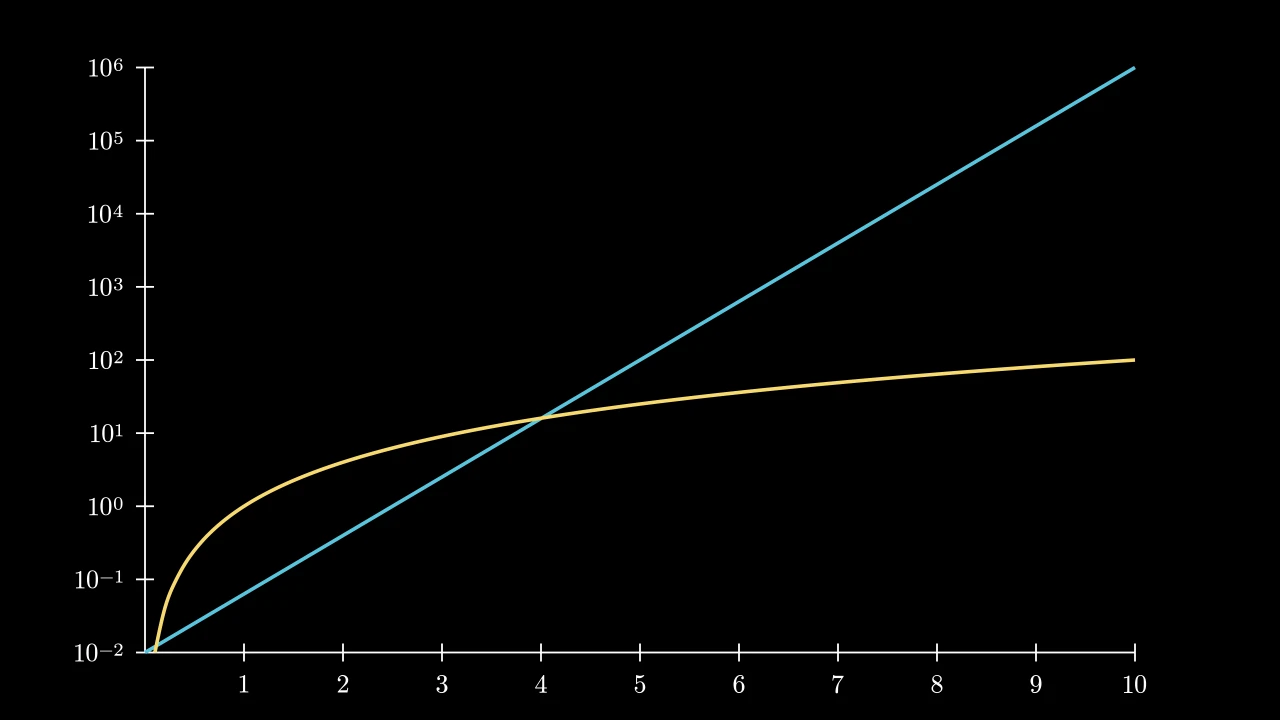
Code
import manimgx as m


class LogBaseExample(m.Scene):
    def construct(self) -> None:
        ax = m.Axes(
            x_range=[0, 10, 1],
            y_range=[-2, 6, 1],
            x_length=11,
            y_length=6.5,
            tips=False,
            axis_config={"include_numbers": True, "font_size": 28},
            y_axis_config={"scaling": m.LogBase()},
        )
        exponential = ax.plot(lambda x: 0.01 * 10 ** (0.8 * x), color=m.BLUE)
        square = ax.plot(lambda x: x**2, x_range=[0.1, 10], color=m.YELLOW)
        self.add(ax, exponential, square)
A logarithmic scale for a number line: its range is of exponents, and its
numbers are powers of base, spaced by their logarithms.
With base 10, a range [0, 3, 1] runs from 1 to 1000, a tick at each power of 10,
and n2p places 100 two thirds of the way along. Its
numbers are all positive: 0 and negative numbers have no place on it. Give it as a
number line's scaling, or an axis's in an axis config; then
plot samples a function over the powers, and
add_coordinates writes the axis's
numbers as powers.
baseThe base of the powers.
custom_labelsWhether the line's numbers are written as powers (10², 10³, …), rather than as decimals.
Source
src/manimgx/mobjects/plotting.py
base 
The base of the powers.
custom_labels 
Whether the line's numbers are written as powers of the base.
function 
The number of the axis at a value of its range: 10² for 2, on a logarithmic axis.
valueThe value of the range; or an array of values.
Returns The number; or the numbers, an array of the same shape.
Source
src/manimgx/mobjects/plotting.py
inverse_function 
The value of the axis's range at one of its numbers: 2 for 100, on a
logarithmic axis; the inverse of function.
valueThe number; or an array of numbers.
Returns The value of the range; or the values, an array of the same shape.
Source
src/manimgx/mobjects/plotting.py