Skip to content

Axes

The film's code
import manimgx as m


class AxesHero(m.Scene):
    def construct(self) -> None:
        axes = m.Axes(x_range=[-1, 5, 1], y_range=[-1, 4, 1], x_length=9, y_length=6)
        axes.add_coordinates()
        names = axes.get_axis_labels("x", "y")
        point = axes.c2p(3, 2)
        dot = m.Dot(point, color=m.YELLOW)
        lines = axes.get_lines_to_point(point, color=m.YELLOW)
        label = m.MathTex("(3, 2)", color=m.YELLOW).next_to(dot, m.UR, buff=0.15)
        self.play(m.Create(axes), m.Write(names))
        self.play(m.GrowFromCenter(dot), m.Create(lines), m.Write(label))
        self.wait()

Axes have a range on each axis, [start, end, step], and a length in the frame: x_range=[-3, 3, 1] numbers the x-axis from −3 to 3 with a tick at every unit, and x_length=8 makes it 8 units long. The axes' coordinates are theirs: the point where x is 2 and y is 4 is axes.c2p(2, 4), wherever the axes are and however long.

Axes

Code
import manimgx as m


class AxesExample(m.Scene):
    def construct(self) -> None:
        axes = m.Axes(
            x_range=[0, 10, 1],
            y_range=[-2, 6, 2],
            x_length=10,
            y_length=6,
            axis_config={"include_numbers": True, "font_size": 28},
        )
        labels = axes.get_axis_labels("t", "v")
        graph = axes.plot(lambda t: 5 - 0.2 * (t - 4) ** 2, color=m.BLUE)
        self.add(axes, labels)
        self.play(m.Create(graph))

Axes: number lines through one origin, with coordinates of their own, and the tools to plot on them; white, with tips, unless configured.

Axis option maps are construction inputs. The finished number lines retain their own defaults for later ticks, labels and coordinates.

The x-axis runs over x_range and the y-axis over y_range, each a NumberLine with ticks at every step of its range. The axes cross at their 0 (or, for a range without 0, at its end nearest 0), and the point of the middle of both ranges is put at the scene's origin. On a linear axis the tick at 0 is left out, where the other axis crosses; numbers are written at the ticks but 0 (see add_coordinates).

coords_to_point (c2p, or axes @ (x, y)) and point_to_coords (p2c) convert between the axes' coordinates and the scene's points. The plot methods draw on the axes, in their coordinates: graphs of functions, curves given implicitly or in polar coordinates, line graphs. The get_ methods make what explains a graph: its label, the area under it, Riemann rectangles, a secant, lines to a point. All of them return new mobjects, not added to the axes.

m.Axes(x_range=None, y_range=None, x_length=None, y_length=None, axis_config=None, x_axis_config=None, y_axis_config=None, tips=True, **kwargs)
x_range

The x-axis's range, [x_min, x_max, x_step], or [x_min, x_max] for a step of 1; None for the frame's width, [-7, 7, 1].

y_range

The y-axis's range, likewise; None for the frame's height, [-4, 4, 1].

x_length

The x-axis's length, in scene units; None for the frame's width less 2, rounded, as the frame is when the axes are made (12 in a wide video, 6 in a tall one), or unit_size per unit if the axis's config gives one.

y_length

The y-axis's length, in scene units; None for the frame's height less 2, rounded (6 in a wide video, 12 in a tall one), or unit_size per unit if the axis's config gives one.

axis_config

Number line keywords for both axes: include_numbers, font_size, color, …; None for none.

x_axis_config

Number line keywords for the x-axis, over axis_config's; None for none.

y_axis_config

Number line keywords for the y-axis, over axis_config's; None for none.

tips

Whether each axis ends in an arrow tip.

color

The color of both fill and stroke (default white); None for the class's default.

fill_color

The fill's color; color if not given. Several colors make a gradient along sheen_direction.

fill_opacity

The fill's opacity, from 0 to 1 (default 0: no fill).

stroke_color

The stroke's color; color if not given. Several colors make a gradient.

stroke_opacity

The stroke's opacity, from 0 to 1 (default 1).

stroke_width

The stroke's width, in hundredths of a scene unit (default 4; 0: no stroke).

background_stroke_color

The color of an outline drawn behind the fill (default black).

background_stroke_opacity

The outline's opacity, from 0 to 1 (default 1).

background_stroke_width

The outline's width, in hundredths of a scene unit (default 0: none).

sheen_factor

How much the colors lighten toward sheen_direction, from -1 to 1 (default 0); a negative factor darkens.

sheen_direction

The direction the colors lighten toward (default UL).

joint_type

How the stroke is joined where its path turns: round, beveled or mitered, as a two-dimensional scene draws it (see LineJointType; default AUTO: mitered).

cap_style

How the stroke ends, at each end it shows (an open path's, a dash's): round, butt or square, as a two-dimensional scene draws it (see CapStyleType; default AUTO: butt).

shade_in_3d

Whether a three-dimensional scene's light shades the mobject.

material

How its surface reflects the scene's lights in a three-dimensional scene (see Material); None: Manim's shading (default).

name

A name for the mobject; its class's name if not given.

z_index

Its place in the drawing order: a higher index is drawn over a lower one (default 0).

target

The state MoveToTarget moves the mobject to.

It also takes the style keywords.

Source

src/manimgx/mobjects/plotting.py

def __init__(
    self,
    x_range: Sequence[float] | None = None,
    y_range: Sequence[float] | None = None,
    x_length: float | None = None,
    y_length: float | None = None,
    axis_config: NumberLineOptions | None = None,
    x_axis_config: NumberLineOptions | None = None,
    y_axis_config: NumberLineOptions | None = None,
    tips: bool = True,
    **kwargs: Unpack[Style],
):
    super().__init__(**kwargs)
    self.dimension = 2
    self.x_range = _full_range(x_range, config.frame_x_radius)
    """The x-axis's range, `[x_min, x_max, x_step]`."""
    self.y_range = _full_range(y_range, config.frame_y_radius)
    """The y-axis's range, `[y_min, y_max, y_step]`."""
    self.num_sampled_graph_points_per_tick = 10
    """How many times per step of the x-axis [plot][manimgx.Axes.plot] samples a
    function, when not given a step (default 10)."""
    axis_config = merged_axis_config(
        {"include_tip": tips, "numbers_to_exclude": [0]}, axis_config
    )
    x_axis_config = _origin_tick(merged_axis_config(axis_config, x_axis_config))
    y_axis_config = _origin_tick(
        merged_axis_config(
            axis_config,
            {"rotation": 90 * DEGREES, "label_direction": LEFT},
            y_axis_config,
        )
    )
    self.x_axis = self._create_axis(self.x_range, x_axis_config, x_length, 0)
    """The x-axis, a [NumberLine][manimgx.NumberLine]."""
    self.y_axis = self._create_axis(self.y_range, y_axis_config, y_length, 1)
    """The y-axis, a [NumberLine][manimgx.NumberLine]."""
    self.x_length, self.y_length = (
        self.x_axis.get_length(),
        self.y_axis.get_length(),
    )
    self.axes = Group[NumberLine](self.x_axis, self.y_axis)
    """The axes, in a group: the x-axis, the y-axis (and the z-axis, in 3D)."""
    self.add(*self.axes)
    lines_center_point = [
        axis.scaling.function((axis.x_range[1] + axis.x_range[0]) / 2)
        for axis in self.axes
    ]
    self.shift(-self.coords_to_point(*lines_center_point))

x_range

The x-axis's range, [x_min, x_max, x_step].

y_range

The y-axis's range, [y_min, y_max, y_step].

x_axis

The x-axis, a NumberLine.

y_axis

The y-axis, a NumberLine.

axes

The axes, in a group: the x-axis, the y-axis (and the z-axis, in 3D).

Coordinates

coords_to_point

Code
import manimgx as m


class AxesCoordsToPointExample(m.Scene):
    def construct(self) -> None:
        axes = m.Axes(
            x_range=[0, 6], y_range=[0, 4], x_length=10, y_length=6
        )
        dot = m.Dot(axes.c2p(1, 1), radius=0.15, color=m.YELLOW)
        self.add(axes.add_coordinates(), dot)
        self.play(dot.animate.move_to(axes.c2p(5, 3)))
        self.play(dot.animate.move_to(axes @ (3, 0.5)))

Convert coordinates on the axes to a point of the scene, or arrays of them to points.

c2p is its short name, and axes @ (x, y) its shortest. Coordinates past the ends of the axes are on the axes extended; a missing one is where the axes cross (c2p(x) is on the x-axis). Given an array per axis, of any shape (a grid too), it converts them all at once.

axes.coords_to_point(*coords)
*coords

The coordinates, one per axis, in order: numbers, or arrays of one shape.

Returns The point, in scene coordinates; for arrays, the points, with the coordinates first (3, then the arrays' shape).

Source

src/manimgx/mobjects/plotting.py

def coords_to_point(self, *coords: Coordinates) -> npt.NDArray[np.float64]:
    """Convert coordinates on the axes to a point of the scene, or arrays of them to
    points.

    `c2p` is its short name, and `axes @ (x, y)` its shortest. Coordinates past the
    ends of the axes are on the axes extended; a missing one is where the axes
    cross (`c2p(x)` is on the x-axis). Given an array per axis, of any shape (a
    grid too), it converts them all at once.

    Args:
        *coords: The coordinates, one per axis, in order: numbers, or arrays of one
            shape.

    Returns:
        The point, in scene coordinates; for arrays, the points, with the
        coordinates first (3, then the arrays' shape).

    Examples:
        ```python
        import manimgx as m


        class AxesCoordsToPointExample(m.Scene):
            def construct(self) -> None:
                axes = m.Axes(
                    x_range=[0, 6], y_range=[0, 4], x_length=10, y_length=6
                )
                dot = m.Dot(axes.c2p(1, 1), radius=0.15, color=m.YELLOW)
                self.add(axes.add_coordinates(), dot)
                self.play(dot.animate.move_to(axes.c2p(5, 3)))
                self.play(dot.animate.move_to(axes @ (3, 0.5)))
        ```
    """
    origin = self.x_axis.number_to_point(
        _origin_shift([self.x_axis.x_min, self.x_axis.x_max])
    )
    points = self.x_axis.number_to_point(np.asarray(coords[0], dtype=float))
    for axis, nums in zip(self.axes.submobjects[1:], coords[1:], strict=False):
        points = (
            points + axis.number_to_point(np.asarray(nums, dtype=float)) - origin
        )
    return points if points.ndim == 1 else np.moveaxis(points, -1, 0)

point_to_coords

Convert a point of the scene to its coordinates on the axes, or points to theirs.

p2c is its short name. Each coordinate is the axis's number at the point's projection onto it: for perpendicular axes, the inverse of coords_to_point.

axes.point_to_coords(point)
point

The point, in scene coordinates; or an (n, 3) array of points.

Returns The coordinates, one per axis; for n points, an array of n rows of them.

Source

src/manimgx/mobjects/plotting.py

def point_to_coords(
    self, point: Point3DLike | Point3DLike_Array
) -> npt.NDArray[np.float64]:
    """Convert a point of the scene to its coordinates on the axes, or points to
    theirs.

    `p2c` is its short name. Each coordinate is the axis's number at the point's
    projection onto it: for perpendicular axes, the inverse of
    [coords_to_point][manimgx.Axes.coords_to_point].

    Args:
        point: The point, in scene coordinates; or an (n, 3) array of points.

    Returns:
        The coordinates, one per axis; for n points, an array of n rows of them.
    """
    array = np.asarray(point, dtype=float)
    result = np.asarray([axis.point_to_number(array) for axis in self.axes])
    return result.T if array.ndim == 2 else result

polar_to_point

Convert polar coordinates on the axes to a point of the scene.

pr2pt is its short name. The point is at the coordinates (radius cos azimuth, radius sin azimuth).

axes.polar_to_point(radius, azimuth)
radius

The distance from the origin, in the axes' units.

azimuth

The angle from the positive x-axis, in radians, counterclockwise.

Returns The point, in scene coordinates.

Source

src/manimgx/mobjects/plotting.py

def polar_to_point(self, radius: float, azimuth: float) -> npt.NDArray[np.float64]:
    """Convert polar coordinates on the axes to a point of the scene.

    `pr2pt` is its short name. The point is at the coordinates
    (`radius` cos `azimuth`, `radius` sin `azimuth`).

    Args:
        radius: The distance from the origin, in the axes' units.
        azimuth: The angle from the positive x-axis, in radians, counterclockwise.

    Returns:
        The point, in scene coordinates.
    """
    return self.coords_to_point(radius * np.cos(azimuth), radius * np.sin(azimuth))

get_origin

The point of the coordinates (0, 0): where the axes cross, if their ranges contain 0.

axes.get_origin()

Returns The point, in scene coordinates.

Source

src/manimgx/mobjects/plotting.py

def get_origin(self) -> Point3D:
    """The point of the coordinates (0, 0): where the axes cross, if their ranges
    contain 0.

    Returns:
        The point, in scene coordinates.
    """
    return self.coords_to_point(0, 0)

get_x_unit_size

The length of one unit of the x-axis.

axes.get_x_unit_size()

Returns The length, in scene units.

Source

src/manimgx/mobjects/plotting.py

def get_x_unit_size(self) -> float:
    """The length of one unit of the x-axis.

    Returns:
        The length, in scene units.
    """
    return self.get_x_axis().get_unit_size()

get_y_unit_size

The length of one unit of the y-axis.

axes.get_y_unit_size()

Returns The length, in scene units.

Source

src/manimgx/mobjects/plotting.py

def get_y_unit_size(self) -> float:
    """The length of one unit of the y-axis.

    Returns:
        The length, in scene units.
    """
    return self.get_y_axis().get_unit_size()

Each axis

get_x_axis

The x-axis.

axes.get_x_axis()

Returns The axis, a NumberLine.

Source

src/manimgx/mobjects/plotting.py

def get_x_axis(self) -> NumberLine:
    """The x-axis.

    Returns:
        The axis, a [NumberLine][manimgx.NumberLine].
    """
    return self.get_axis(0)

get_y_axis

The y-axis.

axes.get_y_axis()

Returns The axis, a NumberLine.

Source

src/manimgx/mobjects/plotting.py

def get_y_axis(self) -> NumberLine:
    """The y-axis.

    Returns:
        The axis, a [NumberLine][manimgx.NumberLine].
    """
    return self.get_axis(1)

get_z_axis

The z-axis, of three-dimensional axes.

axes.get_z_axis()

Returns The axis, a NumberLine.

Source

src/manimgx/mobjects/plotting.py

def get_z_axis(self) -> NumberLine:
    """The z-axis, of three-dimensional axes.

    Returns:
        The axis, a [NumberLine][manimgx.NumberLine].
    """
    return self.get_axis(2)

get_axis

One of the axes.

axes.get_axis(index)
index

The axis's index: 0 for x, 1 for y, 2 for z.

Returns The axis, a NumberLine.

Source

src/manimgx/mobjects/plotting.py

def get_axis(self, index: int) -> NumberLine:
    """One of the axes.

    Args:
        index: The axis's index: 0 for x, 1 for y, 2 for z.

    Returns:
        The axis, a [NumberLine][manimgx.NumberLine].
    """
    return self.get_axes()[index]

get_axes

The axes: the x-axis, the y-axis (and the z-axis, in 3D).

axes.get_axes()

Returns The group of the axes, each a NumberLine.

Source

src/manimgx/mobjects/plotting.py

def get_axes(self) -> Group[NumberLine]:
    """The axes: the x-axis, the y-axis (and the z-axis, in 3D).

    Returns:
        The group of the axes, each a [NumberLine][manimgx.NumberLine].
    """
    return self.axes

Labels and numbers

add_coordinates

AxesAddCoordinatesExample
Code
import manimgx as m


class AxesAddCoordinatesExample(m.Scene):
    def construct(self) -> None:
        axes = m.Axes(
            x_range=[0, 5], y_range=[0, 1, 0.25], x_length=10, y_length=6
        )
        axes.add_coordinates(
            {1: "one", 2: "two", 3: "three", 4: "four"}, None, font_size=30
        )
        self.add(axes)

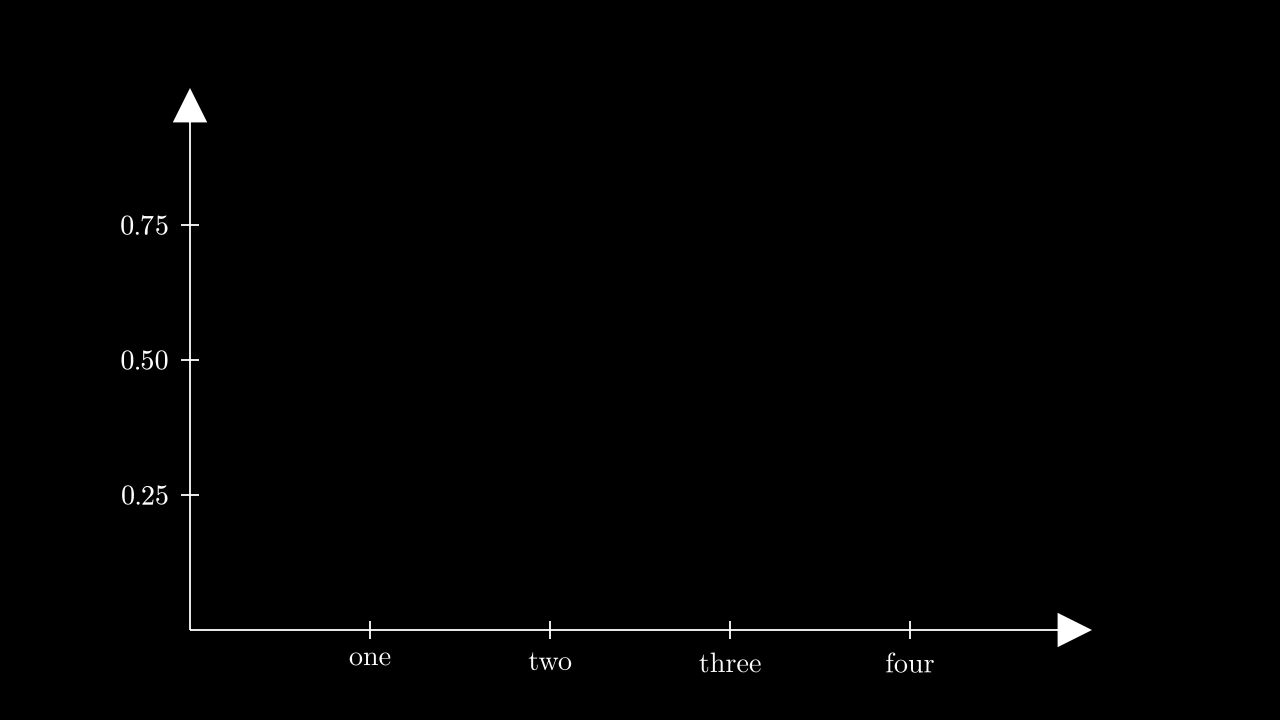
Number the axes: at their ticks, at the values given, or with labels by value.

Give one argument per axis, in order: None numbers the axis at its ticks, but 0 (on a logarithmic axis, as powers: 10², 10³, …); values number it at those values; a dictionary from values to labels (strings, numbers or typeset mobjects) puts each label by its value (see add_labels). Without arguments, every axis is numbered at its ticks. The numbers are added to the axes, and kept, one group per axis, as the axes' coordinate_labels.

axes.add_coordinates(*axes_numbers, **kwargs)
*axes_numbers

What to write on each axis, in order: None, values, or labels by value; the axes past the last argument get nothing.

It also takes the DecimalNumber keywords.

Source

src/manimgx/mobjects/plotting.py

def add_coordinates(
    self,
    *axes_numbers: Iterable[float] | Mapping[float, Label] | None,
    **kwargs: Unpack[DecimalNumberOptions],
) -> Self:
    """Number the axes: at their ticks, at the values given, or with labels by
    value.

    Give one argument per axis, in order: None numbers the axis at its ticks, but
    0 (on a logarithmic axis, as powers: 10², 10³, …); values number it at those
    values; a dictionary from values to labels (strings, numbers or typeset
    mobjects) puts each label by its value (see
    [add_labels][manimgx.NumberLine.add_labels]). Without arguments, every axis is
    numbered at its ticks. The numbers are added to the axes, and kept, one group
    per axis, as the axes' `coordinate_labels`.

    Args:
        *axes_numbers: What to write on each axis, in order: None, values, or
            labels by value; the axes past the last argument get nothing.
        **kwargs: [Number keywords][manimgx.DecimalNumber]
            for the numbers: `font_size`, `num_decimal_places`, `color`, … (only
            `font_size`, for labels by value).

    Examples:
        ```python
        import manimgx as m


        class AxesAddCoordinatesExample(m.Scene):
            def construct(self) -> None:
                axes = m.Axes(
                    x_range=[0, 5], y_range=[0, 1, 0.25], x_length=10, y_length=6
                )
                axes.add_coordinates(
                    {1: "one", 2: "two", 3: "three", 4: "four"}, None, font_size=30
                )
                self.add(axes)
        ```
    """
    self.coordinate_labels = VGroup()
    for axis, values in zip(
        self.axes, axes_numbers or (None,) * self.dimension, strict=False
    ):
        if isinstance(values, Mapping):
            axis.add_labels(values, font_size=kwargs.get("font_size"))
            labels = axis.labels
        elif values is None and axis.scaling.custom_labels:
            tick_range = axis.get_tick_range()
            axis.add_labels(
                dict(
                    zip(
                        tick_range,
                        axis.scaling.get_custom_labels(tick_range),
                        strict=True,
                    )
                )
            )
            labels = axis.labels
        else:
            axis.add_numbers(values, **kwargs)
            labels = axis.numbers
        self.coordinate_labels.add(labels)
    return self

get_axis_labels

AxesGetAxisLabelsExample
Code
import manimgx as m


class AxesGetAxisLabelsExample(m.Scene):
    def construct(self) -> None:
        axes = m.Axes(x_range=[0, 10], y_range=[0, 5], x_length=10)
        labels = axes.get_axis_labels(m.Tex("time"), m.Tex("height"))
        self.add(axes, labels)

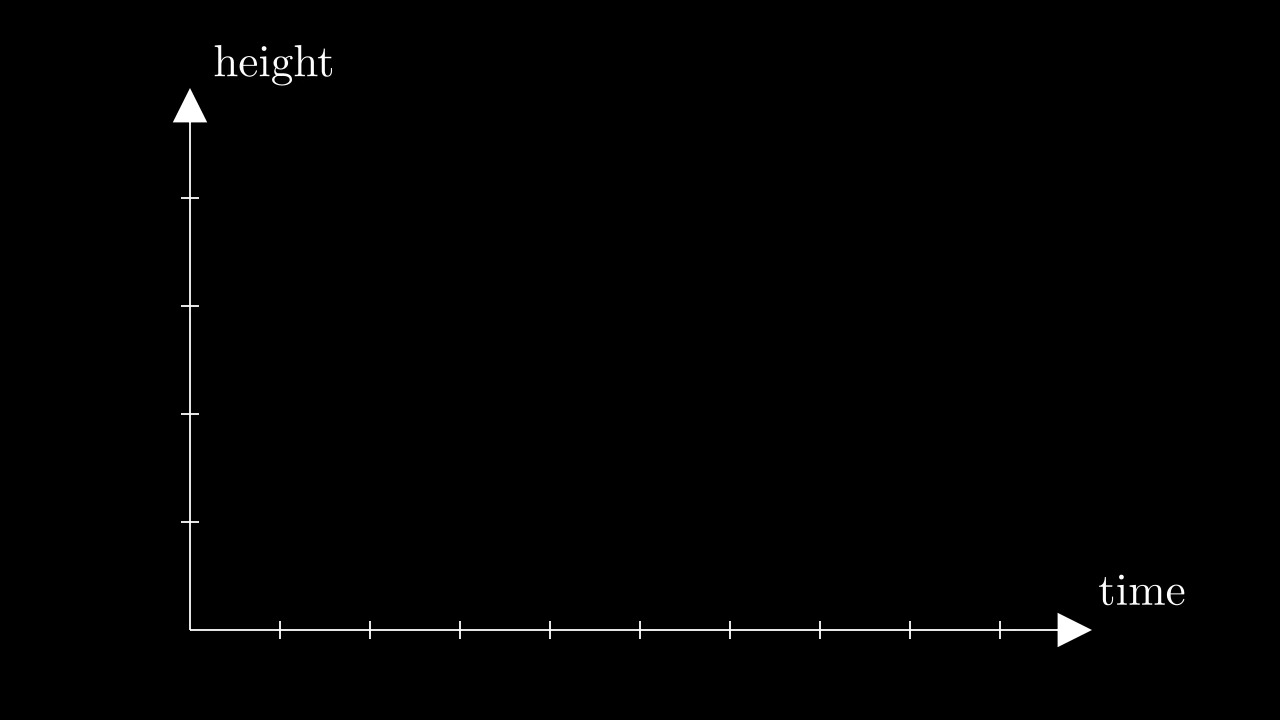
Make a label for each axis, by its end, as get_x_axis_label and get_y_axis_label place them.

axes.get_axis_labels(x_label='x', y_label='y')
x_label

The x-axis's label: a string or a number, typeset as math, or a mobject.

y_label

The y-axis's label, likewise.

Returns A new group of the labels, kept as the axes' axis_labels; not added to the axes.

Source

src/manimgx/mobjects/plotting.py

def get_axis_labels(self, x_label: Label = "x", y_label: Label = "y") -> VGroup:
    """Make a label for each axis, by its end, as
    [get_x_axis_label][manimgx.Axes.get_x_axis_label] and
    [get_y_axis_label][manimgx.Axes.get_y_axis_label] place them.

    Args:
        x_label: The x-axis's label: a string or a number, typeset as math, or a
            mobject.
        y_label: The y-axis's label, likewise.

    Returns:
        A new group of the labels, kept as the axes' `axis_labels`; not added to
        the axes.

    Examples:
        ```python
        import manimgx as m


        class AxesGetAxisLabelsExample(m.Scene):
            def construct(self) -> None:
                axes = m.Axes(x_range=[0, 10], y_range=[0, 5], x_length=10)
                labels = axes.get_axis_labels(m.Tex("time"), m.Tex("height"))
                self.add(axes, labels)
        ```
    """
    self.axis_labels = VGroup(
        self.get_x_axis_label(x_label), self.get_y_axis_label(y_label)
    )
    return self.axis_labels

get_x_axis_label

Make a label for the x-axis, by its end.

A string or a number is typeset with the axes' label_constructor (as math, with MathTex, by default); a mobject is used as it is. The label is put next to a corner of the axis, toward direction, then moved onto the screen if it is off it.

axes.get_x_axis_label(label, edge=UR, direction=UR, buff=SMALL_BUFF)
label

The label: a string, a number or a mobject.

edge

The corner of the axis the label is put by, as a direction: UR, the upper right one, by its end.

direction

The direction the label is put toward, from that corner.

buff

The gap between the corner and the label, in scene units.

Returns The label, not added to the axes.

Source

src/manimgx/mobjects/plotting.py

def get_x_axis_label(
    self,
    label: Label,
    edge: Vector3DLike = UR,
    direction: Vector3DLike = UR,
    buff: float = SMALL_BUFF,
) -> Mobject:
    """Make a label for the x-axis, by its end.

    A string or a number is typeset with the axes' `label_constructor` (as math,
    with [MathTex][manimgx.MathTex], by default); a mobject is used as it is. The
    label is put next to a corner of the axis, toward `direction`, then moved onto
    the screen if it is off it.

    Args:
        label: The label: a string, a number or a mobject.
        edge: The corner of the axis the label is put by, as a direction: UR, the
            upper right one, by its end.
        direction: The direction the label is put toward, from that corner.
        buff: The gap between the corner and the label, in scene units.

    Returns:
        The label, not added to the axes.
    """
    return self._get_axis_label(
        label, self.get_x_axis(), edge, direction, buff=buff
    )

get_y_axis_label

Make a label for the y-axis, by its end.

A string or a number is typeset with the axes' label_constructor (as math, with MathTex, by default); a mobject is used as it is. The label is put next to a corner of the axis, toward direction, then moved onto the screen if it is off it.

axes.get_y_axis_label(label, edge=UR, direction=UP * 0.5 + RIGHT, buff=SMALL_BUFF)
label

The label: a string, a number or a mobject.

edge

The corner of the axis the label is put by, as a direction: UR, the upper right one, by its end.

direction

The direction the label is put toward, from that corner: by default up and to the right.

buff

The gap between the corner and the label, in scene units.

Returns The label, not added to the axes.

Source

src/manimgx/mobjects/plotting.py

def get_y_axis_label(
    self,
    label: Label,
    edge: Vector3DLike = UR,
    direction: Vector3DLike = UP * 0.5 + RIGHT,
    buff: float = SMALL_BUFF,
) -> Mobject:
    """Make a label for the y-axis, by its end.

    A string or a number is typeset with the axes' `label_constructor` (as math,
    with [MathTex][manimgx.MathTex], by default); a mobject is used as it is. The
    label is put next to a corner of the axis, toward `direction`, then moved onto
    the screen if it is off it.

    Args:
        label: The label: a string, a number or a mobject.
        edge: The corner of the axis the label is put by, as a direction: UR, the
            upper right one, by its end.
        direction: The direction the label is put toward, from that corner: by
            default up and to the right.
        buff: The gap between the corner and the label, in scene units.

    Returns:
        The label, not added to the axes.
    """
    return self._get_axis_label(
        label, self.get_y_axis(), edge, direction, buff=buff
    )

Lines to a point

get_vertical_line

Make a line from the x-axis up (or down) to a point: dashed, white and thin unless styled.

axes.get_vertical_line(point, **kwargs)
point

The point, in scene coordinates.

line_func

The class of the line (default DashedLine; a Line is solid).

line_config

Dashed line keywords for the line, but its color and width, which color and stroke_width set (default None: none).

color

The line's color (default None: white).

stroke_width

The line's width, in hundredths of a scene unit (default 2).

Returns A new line, not added to the axes.

Source

src/manimgx/mobjects/plotting.py

def get_vertical_line(self, point: Point3DLike, **kwargs: Unpack[AxisLine]) -> Line:
    """Make a line from the x-axis up (or down) to a point: dashed, white and thin
    unless styled.

    Args:
        point: The point, in scene coordinates.
        **kwargs: [Axis line keywords][manimgx.mobjects.plotting.AxisLine]:
            the line's class, keywords, `color` and `stroke_width`.

    Returns:
        A new line, not added to the axes.
    """
    return self.get_line_from_axis_to_point(0, point, **kwargs)

get_horizontal_line

Make a line from the y-axis across to a point: dashed, white and thin unless styled.

axes.get_horizontal_line(point, **kwargs)
point

The point, in scene coordinates.

line_func

The class of the line (default DashedLine; a Line is solid).

line_config

Dashed line keywords for the line, but its color and width, which color and stroke_width set (default None: none).

color

The line's color (default None: white).

stroke_width

The line's width, in hundredths of a scene unit (default 2).

Returns A new line, not added to the axes.

Source

src/manimgx/mobjects/plotting.py

def get_horizontal_line(
    self, point: Point3DLike, **kwargs: Unpack[AxisLine]
) -> Line:
    """Make a line from the y-axis across to a point: dashed, white and thin unless
    styled.

    Args:
        point: The point, in scene coordinates.
        **kwargs: [Axis line keywords][manimgx.mobjects.plotting.AxisLine]:
            the line's class, keywords, `color` and `stroke_width`.

    Returns:
        A new line, not added to the axes.
    """
    return self.get_line_from_axis_to_point(1, point, **kwargs)

get_lines_to_point

Code
import manimgx as m


class AxesGetLinesToPointExample(m.Scene):
    def construct(self) -> None:
        axes = m.Axes(x_range=[0, 6], y_range=[0, 4], x_length=10)
        dot = m.Dot(axes.c2p(4, 3), radius=0.15, color=m.YELLOW)
        lines = axes.get_lines_to_point(dot.get_center(), color=m.BLUE)
        self.add(axes.add_coordinates(), dot)
        self.play(m.Create(lines))

Make the lines from both axes to a point: the horizontal one from the y-axis, then the vertical one from the x-axis.

axes.get_lines_to_point(point, **kwargs)
point

The point, in scene coordinates.

line_func

The class of the line (default DashedLine; a Line is solid).

line_config

Dashed line keywords for the line, but its color and width, which color and stroke_width set (default None: none).

color

The line's color (default None: white).

stroke_width

The line's width, in hundredths of a scene unit (default 2).

Returns A new group of the two lines, not added to the axes.

Source

src/manimgx/mobjects/plotting.py

def get_lines_to_point(
    self, point: Point3DLike, **kwargs: Unpack[AxisLine]
) -> VGroup:
    """Make the lines from both axes to a point: the
    [horizontal][manimgx.Axes.get_horizontal_line] one from the y-axis, then the
    [vertical][manimgx.Axes.get_vertical_line] one from the x-axis.

    Args:
        point: The point, in scene coordinates.
        **kwargs: [Axis line keywords][manimgx.mobjects.plotting.AxisLine]
            for both lines.

    Returns:
        A new group of the two lines, not added to the axes.

    Examples:
        ```python
        import manimgx as m


        class AxesGetLinesToPointExample(m.Scene):
            def construct(self) -> None:
                axes = m.Axes(x_range=[0, 6], y_range=[0, 4], x_length=10)
                dot = m.Dot(axes.c2p(4, 3), radius=0.15, color=m.YELLOW)
                lines = axes.get_lines_to_point(dot.get_center(), color=m.BLUE)
                self.add(axes.add_coordinates(), dot)
                self.play(m.Create(lines))
        ```
    """
    return VGroup(
        self.get_horizontal_line(point, **kwargs),
        self.get_vertical_line(point, **kwargs),
    )

Axes in three dimensions

ThreeDAxes

ThreeDAxesExample
Code
import manimgx as m


class ThreeDAxesExample(m.ThreeDScene):
    def construct(self) -> None:
        self.set_camera_orientation(phi=60 * m.DEGREES, theta=-50 * m.DEGREES)
        axes = m.ThreeDAxes(
            x_range=(-4, 4),
            y_range=(-4, 4),
            z_range=(-3, 3),
            x_length=8,
            y_length=8,
            z_length=6,
        )
        dot = m.Dot3D(axes.c2p(2, 3, 2), radius=0.15, color=m.YELLOW)
        self.add(axes, axes.get_axis_labels(), dot)

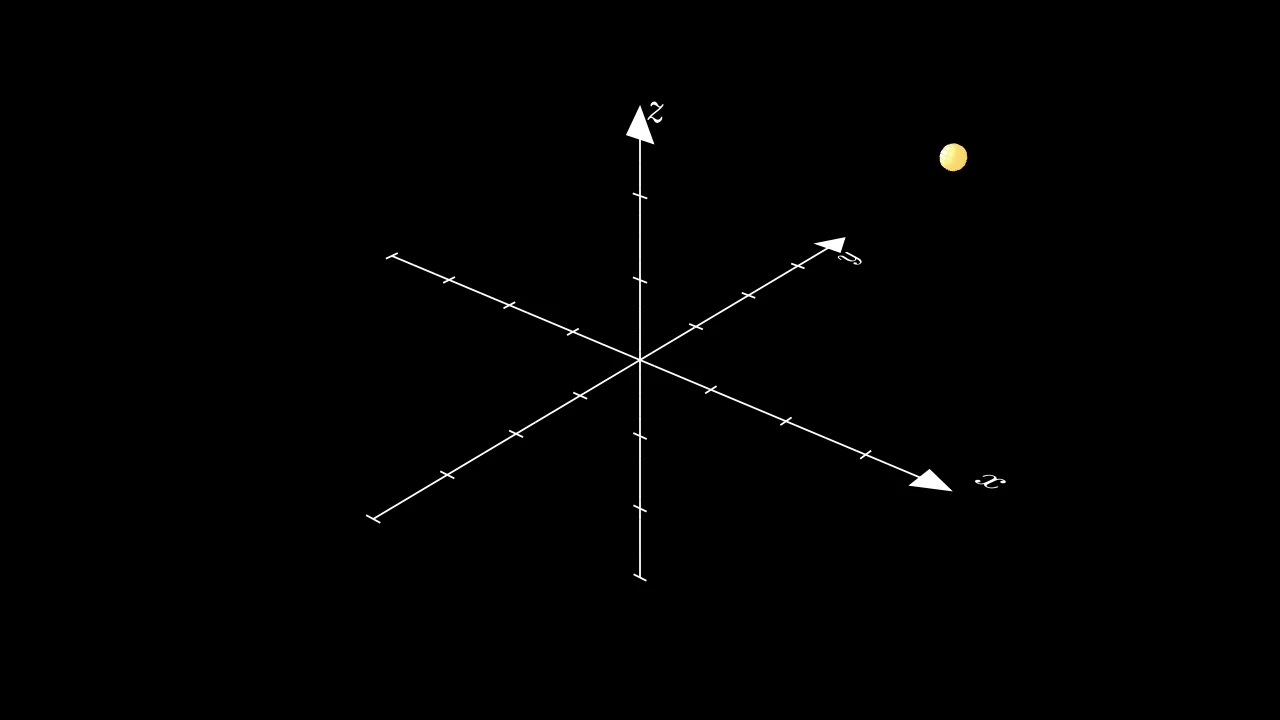
Three-dimensional axes: a z-axis out of the screen, through the origin of x- and y-axes; white, with tips, and shaded by a three-dimensional scene's light, unless configured.

The z-axis is made as the others, over z_range, and points OUT, crossing them at its 0 (or at the end of its range nearest 0). Each axis is drawn as short pieces, shaded as three-dimensional objects are, with a slight sheen toward the light. Coordinates are converted with three numbers, axes.c2p(x, y, z), and everything Axes do, these axes do. Seen from straight above, they look like two-dimensional axes: turn the camera (set_camera_orientation) to see their depth.

Common axis options are captured when construction starts; each finished number line retains its own runtime defaults.

m.ThreeDAxes(x_range=(-6, 6, 1), y_range=(-5, 5, 1), z_range=(-4, 4, 1), x_length=None, y_length=None, z_length=None, z_axis_config=None, **kwargs)
x_range

The x-axis's range, [x_min, x_max, x_step], or [x_min, x_max] for a step of 1; None for [-7, 7, 1].

y_range

The y-axis's range, likewise; None for [-4, 4, 1].

z_range

The z-axis's range, likewise; None for [-7, 7, 1].

x_length

The x-axis's length, in scene units; None for the frame's short side plus 2.5 (10.5, in a wide video and a tall one), or unit_size per unit if the axis's config gives one.

y_length

The y-axis's length, in scene units; None for 10.5 too, or unit_size per unit if the axis's config gives one.

z_length

The z-axis's length, in scene units; None for the frame's short side less 1.5 (6.5), or unit_size per unit if the axis's config gives one.

z_axis_config

Number line keywords for the z-axis, over axis_config's; None for none.

It also takes the Axes keywords.

Source

src/manimgx/mobjects/plotting.py

def __init__(
    self,
    x_range: Sequence[float] | None = (-6, 6, 1),
    y_range: Sequence[float] | None = (-5, 5, 1),
    z_range: Sequence[float] | None = (-4, 4, 1),
    x_length: float | None = None,
    y_length: float | None = None,
    z_length: float | None = None,
    z_axis_config: NumberLineOptions | None = None,
    **kwargs: Unpack[AxesOptions],
):
    axis_config = merged_axis_config(
        {"include_tip": kwargs.get("tips", True), "numbers_to_exclude": [0]},
        kwargs.get("axis_config"),
    )
    kwargs["axis_config"] = axis_config
    super().__init__(
        x_range=x_range,
        x_length=x_length,
        y_range=y_range,
        y_length=y_length,
        **kwargs,
    )
    self.z_range = z_range
    """The z-axis's range, as given."""
    z_axis_config = _origin_tick(merged_axis_config(axis_config, z_axis_config))
    self.dimension = 3
    z_axis = self._create_axis(self.z_range, z_axis_config, z_length, 2)
    z_origin = _origin_shift([z_axis.x_min, z_axis.x_max])
    z_axis.rotate_about_number(z_origin, -PI / 2, UP)
    z_axis.rotate_about_number(z_origin, angle_of_vector(DOWN))
    z_axis.shift(-z_axis.number_to_point(z_origin))
    z_axis.shift(
        self.x_axis.number_to_point(
            _origin_shift([self.x_axis.x_min, self.x_axis.x_max])
        )
    )
    self.axes.add(z_axis)
    self.add(z_axis)
    self.z_axis = z_axis
    """The z-axis, a [NumberLine][manimgx.NumberLine]."""
    self.z_length = z_axis.get_length()
    self._add_3d_pieces()
    self._set_axis_shading()

z_range

The z-axis's range, as given.

z_axis

The z-axis, a NumberLine.

get_y_axis_label

Make a label for the y-axis, by its end, turned to lie along it.

A string or a number is typeset with the axes' label_constructor (as math, with MathTex, by default); a mobject is used as it is. The label is put next to a corner of the axis, toward direction, moved onto the screen if it is off it, then turned about its center.

three_daxes.get_y_axis_label(label, edge=UR, direction=UR, buff=SMALL_BUFF, rotation=PI / 2, rotation_axis=OUT)
label

The label: a string, a number or a mobject.

edge

The corner of the axis the label is put by, as a direction: UR, the upper right one, by its end.

direction

The direction the label is put toward, from that corner.

buff

The gap between the corner and the label, in scene units.

rotation

The angle the label is turned through, in radians: a quarter turn, counterclockwise.

rotation_axis

The axis it is turned about: OUT turns it in the xy-plane.

Returns The label, not added to the axes.

Source

src/manimgx/mobjects/plotting.py

def get_y_axis_label(
    self,
    label: Label,
    edge: Vector3DLike = UR,
    direction: Vector3DLike = UR,
    buff: float = SMALL_BUFF,
    rotation: float = PI / 2,
    rotation_axis: Vector3DLike = OUT,
) -> Mobject:
    """Make a label for the y-axis, by its end, turned to lie along it.

    A string or a number is typeset with the axes' `label_constructor` (as math,
    with [MathTex][manimgx.MathTex], by default); a mobject is used as it is. The
    label is put next to a corner of the axis, toward `direction`, moved onto the
    screen if it is off it, then turned about its center.

    Args:
        label: The label: a string, a number or a mobject.
        edge: The corner of the axis the label is put by, as a direction: UR, the
            upper right one, by its end.
        direction: The direction the label is put toward, from that corner.
        buff: The gap between the corner and the label, in scene units.
        rotation: The angle the label is turned through, in radians: a quarter
            turn, counterclockwise.
        rotation_axis: The axis it is turned about: OUT turns it in the xy-plane.

    Returns:
        The label, not added to the axes.
    """
    placed = super().get_y_axis_label(label, edge, direction, buff)
    return placed.rotate(rotation, axis=rotation_axis)

get_z_axis_label

Make a label for the z-axis, by its end, stood upright.

A string or a number is typeset with the axes' label_constructor (as math, with MathTex, by default); a mobject is used as it is. The label is put next to the axis's end, toward direction, moved onto the screen if it is off it, then turned about its center: by default a quarter turn about RIGHT, which stands it up out of the xy-plane.

three_daxes.get_z_axis_label(label, edge=OUT, direction=RIGHT, buff=SMALL_BUFF, rotation=PI / 2, rotation_axis=RIGHT)
label

The label: a string, a number or a mobject.

edge

The point of the axis the label is put by, as a direction: OUT, its end.

direction

The direction the label is put toward, from that point.

buff

The gap between the point and the label, in scene units.

rotation

The angle the label is turned through, in radians.

rotation_axis

The axis it is turned about.

Returns The label, not added to the axes.

Source

src/manimgx/mobjects/plotting.py

def get_z_axis_label(
    self,
    label: Label,
    edge: Vector3DLike = OUT,
    direction: Vector3DLike = RIGHT,
    buff: float = SMALL_BUFF,
    rotation: float = PI / 2,
    rotation_axis: Vector3DLike = RIGHT,
) -> Mobject:
    """Make a label for the z-axis, by its end, stood upright.

    A string or a number is typeset with the axes' `label_constructor` (as math,
    with [MathTex][manimgx.MathTex], by default); a mobject is used as it is. The
    label is put next to the axis's end, toward `direction`, moved onto the screen
    if it is off it, then turned about its center: by default a quarter turn about
    RIGHT, which stands it up out of the xy-plane.

    Args:
        label: The label: a string, a number or a mobject.
        edge: The point of the axis the label is put by, as a direction: OUT, its
            end.
        direction: The direction the label is put toward, from that point.
        buff: The gap between the point and the label, in scene units.
        rotation: The angle the label is turned through, in radians.
        rotation_axis: The axis it is turned about.

    Returns:
        The label, not added to the axes.
    """
    placed = self._get_axis_label(label, self.z_axis, edge, direction, buff)
    return placed.rotate(rotation, axis=rotation_axis)

get_axis_labels

Make a label for each axis, by its end, as get_x_axis_label, get_y_axis_label and get_z_axis_label place them.

three_daxes.get_axis_labels(x_label='x', y_label='y', z_label='z')
x_label

The x-axis's label: a string or a number, typeset as math, or a mobject.

y_label

The y-axis's label, likewise.

z_label

The z-axis's label, likewise.

Returns A new group of the labels, kept as the axes' axis_labels; not added to the axes.

Source

src/manimgx/mobjects/plotting.py

def get_axis_labels(
    self, x_label: Label = "x", y_label: Label = "y", z_label: Label = "z"
) -> VGroup:
    """Make a label for each axis, by its end, as
    [get_x_axis_label][manimgx.Axes.get_x_axis_label],
    [get_y_axis_label][manimgx.ThreeDAxes.get_y_axis_label] and
    [get_z_axis_label][manimgx.ThreeDAxes.get_z_axis_label] place them.

    Args:
        x_label: The x-axis's label: a string or a number, typeset as math, or a
            mobject.
        y_label: The y-axis's label, likewise.
        z_label: The z-axis's label, likewise.

    Returns:
        A new group of the labels, kept as the axes' `axis_labels`; not added to
        the axes.
    """
    self.axis_labels = VGroup(
        self.get_x_axis_label(x_label),
        self.get_y_axis_label(y_label),
        self.get_z_axis_label(z_label),
    )
    return self.axis_labels