Graphs
The film's code
import manimgx as m
import numpy as np


def wave(x: float) -> float:
    return 1.5 * np.sin(x)


class GraphsHero(m.Scene):
    def construct(self) -> None:
        axes = m.Axes(x_range=[0, 7, 1], y_range=[-2, 2, 1], x_length=10, y_length=5)
        axes.add_coordinates()
        graph = axes.plot(wave, color=m.BLUE)
        area = axes.get_area(graph, x_range=[0, m.PI], opacity=0.4)
        label = axes.get_graph_label(graph, r"1.5 \sin x", x_val=2)
        self.play(m.Create(axes))
        self.play(m.Create(graph), m.Write(label))
        self.play(m.FadeIn(area))
        self.wait()
Axes are a mobject with coordinates of their own. A point on axes is where its numbers are, not where the frame's are: c2p turns the axes' coordinates into a point of the frame, to place anything on a graph. The axes draw graphs in their own coordinates too: the graph of a function, a curve, the area under a graph, its slope.
A number line is one axis. A number plane is axes with a grid, which fills the frame unless you size it. A vector field draws a direction at every point of the plane.
-
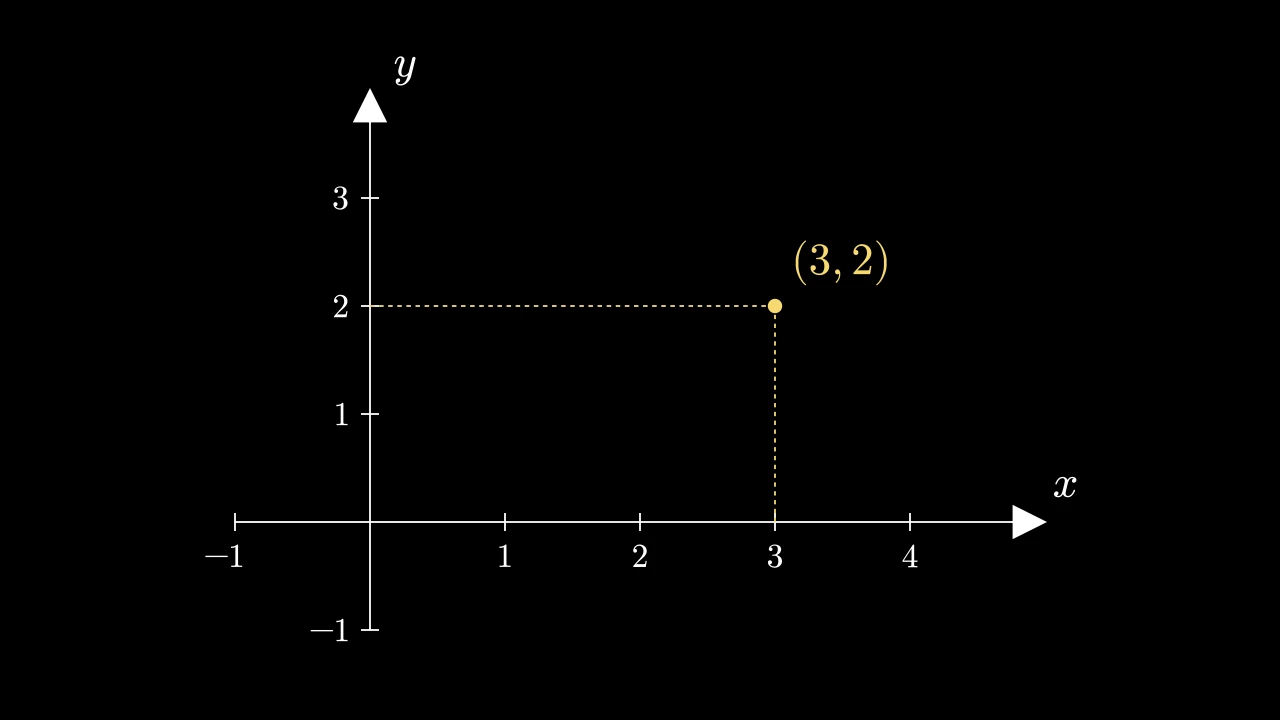
Axes, their coordinates, their labels and numbers, and lines to a point.
-
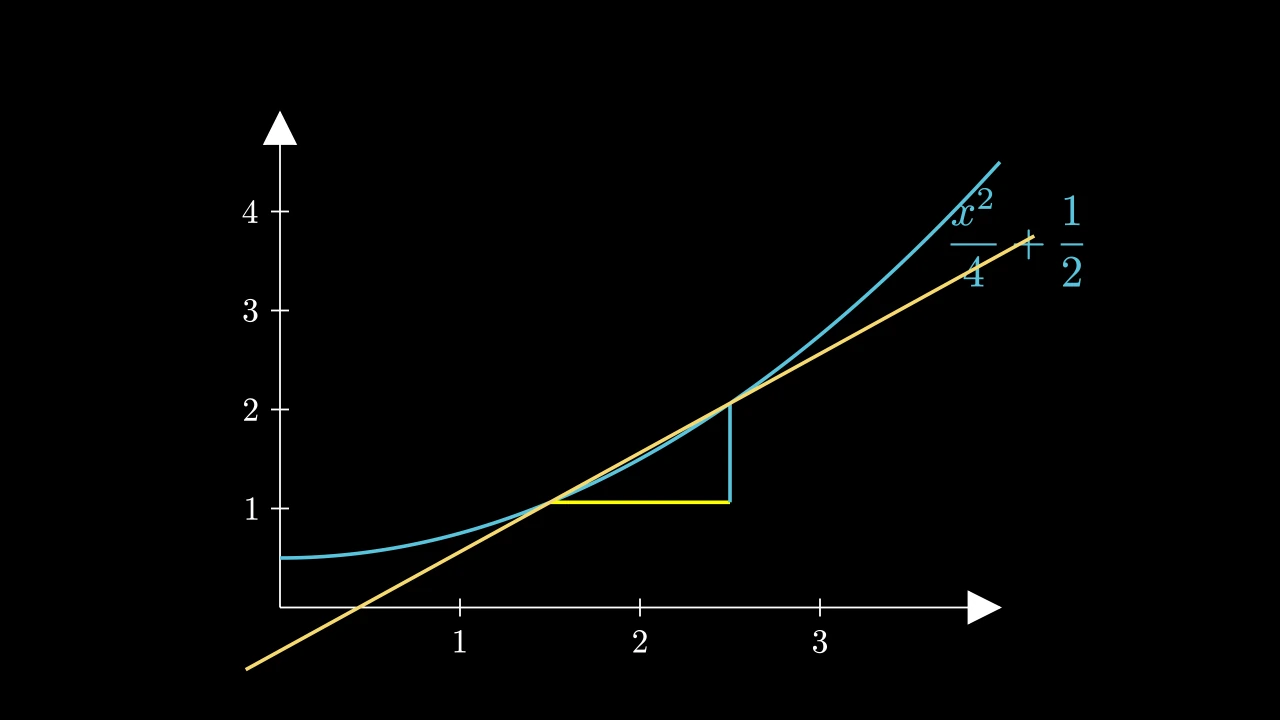
The graph of a function on axes: its label, the area under it, its slope, its derivative.
-
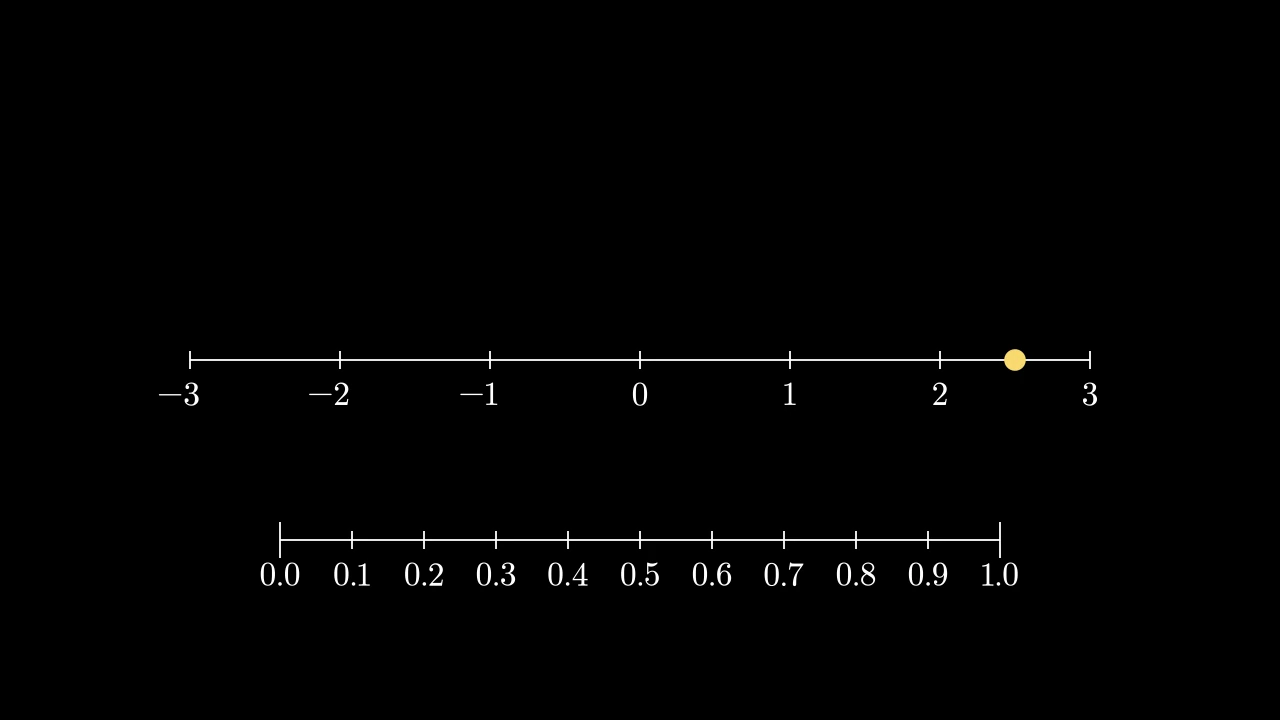
One axis: ticks, numbers and labels, on an even or a logarithmic scale.
-
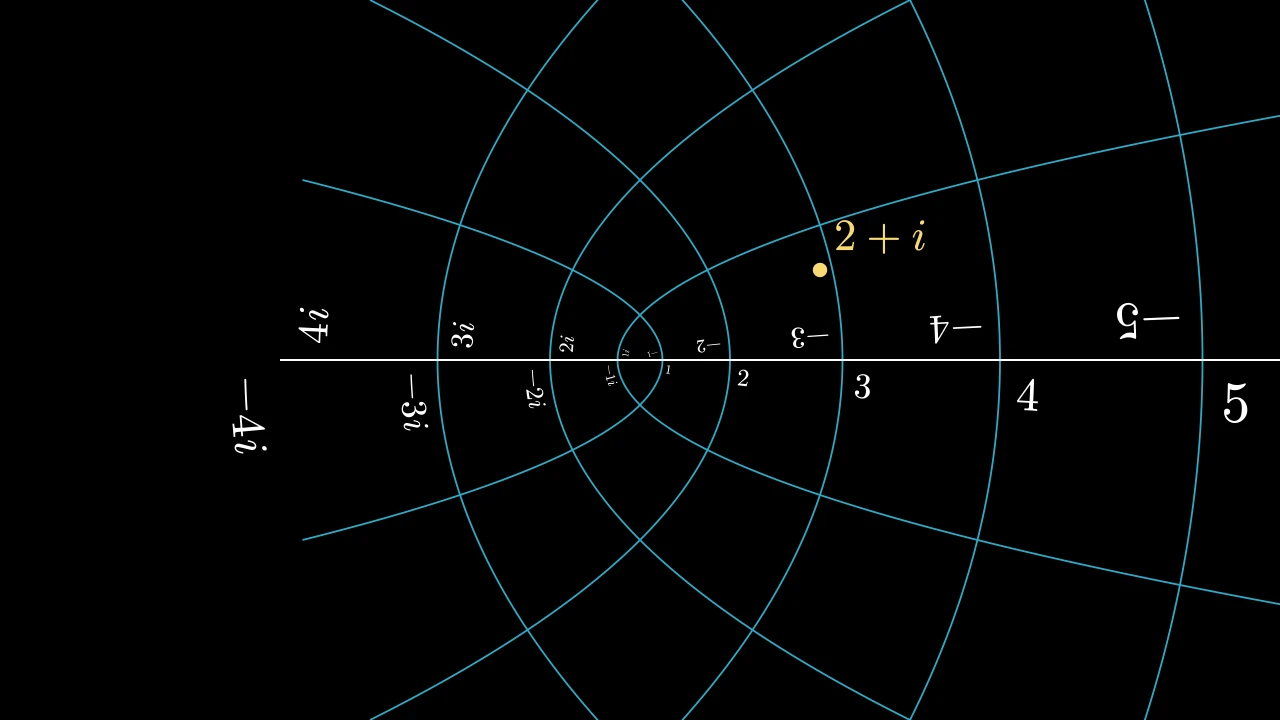
Grids of coordinates: the number plane, the complex plane, the polar plane.
-
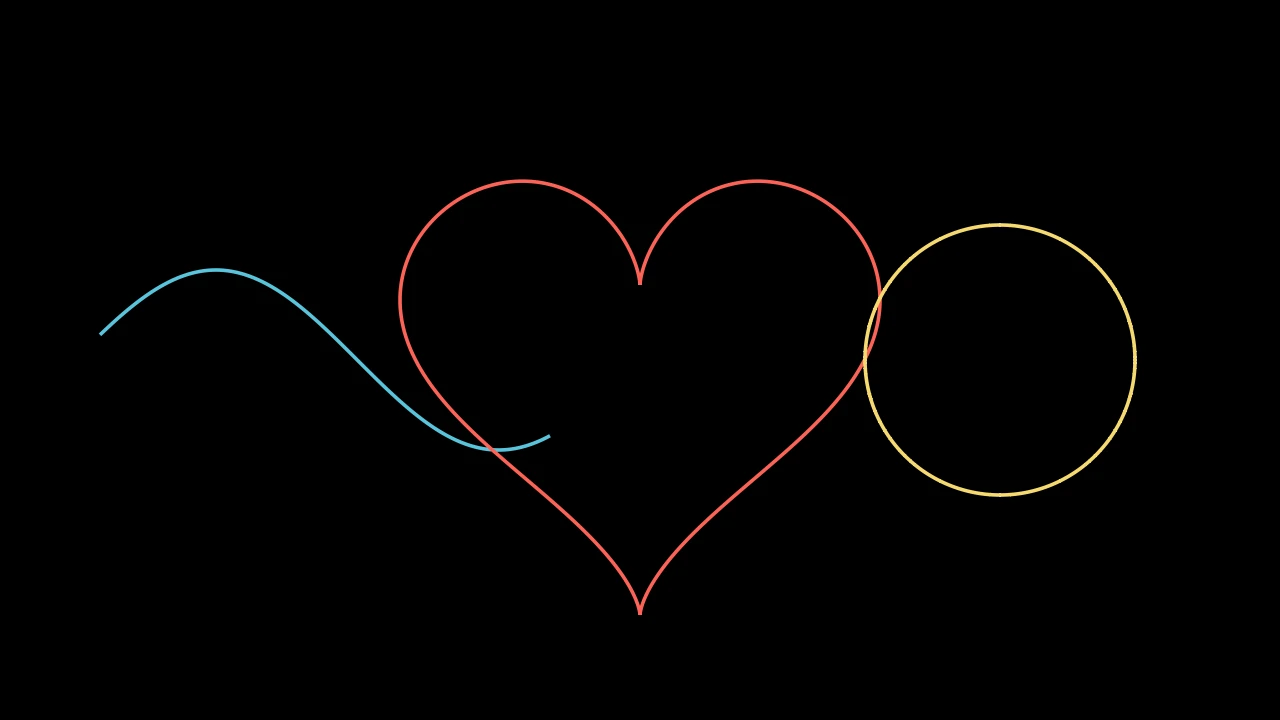
Graphs of functions, parametric curves and implicit curves, in the frame's own coordinates.
-
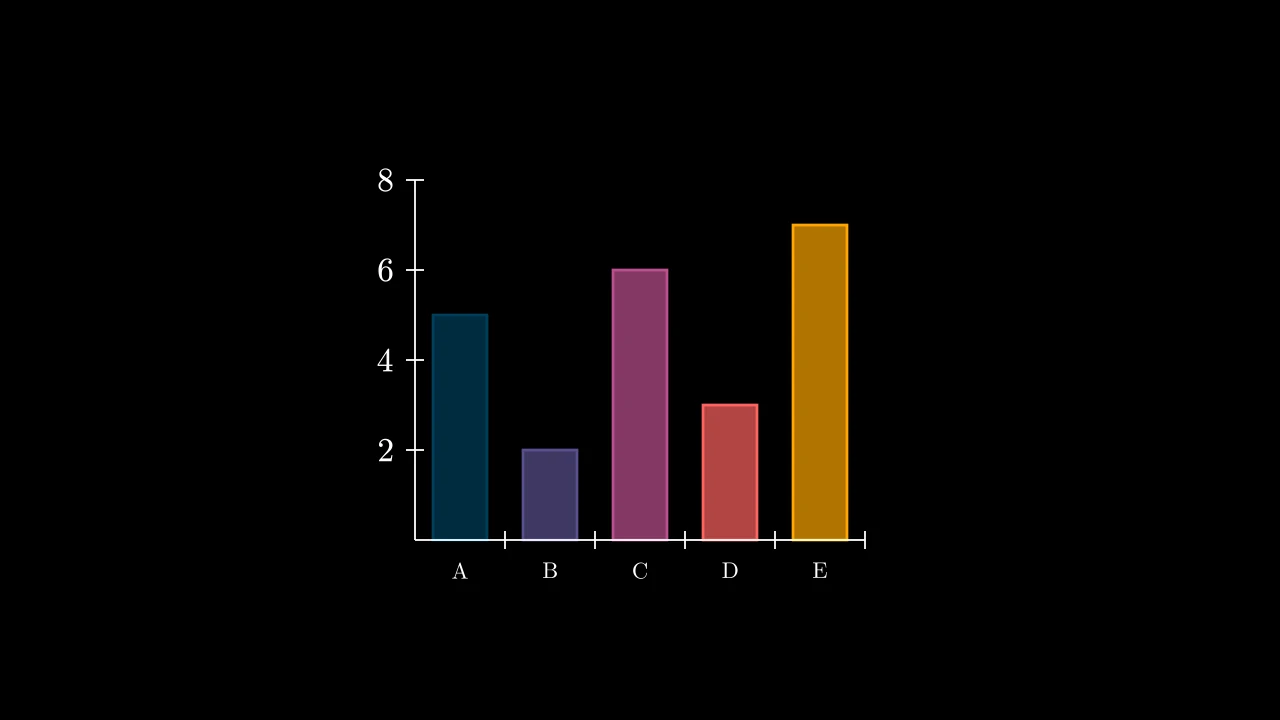
Bar charts, and the sample spaces of probability.
-
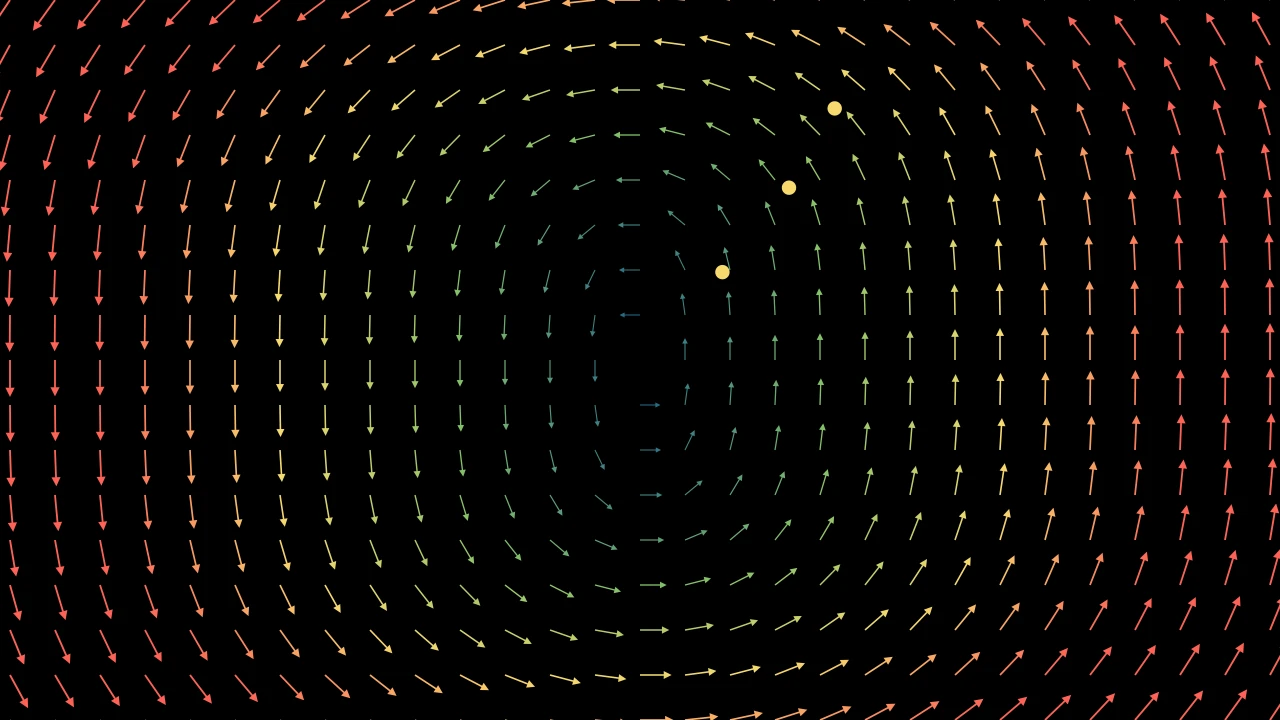
A vector at every point: arrows, stream lines, and mobjects the field carries.