Plotting
The film's code
import manimgx as m


def curve(x: float) -> float:
    return 0.25 * x**2 + 0.5


class PlottingHero(m.Scene):
    def construct(self) -> None:
        axes = m.Axes(x_range=[0, 4, 1], y_range=[0, 5, 1], x_length=8, y_length=5.5)
        axes.add_coordinates()
        graph = axes.plot(curve, color=m.BLUE)
        label = axes.get_graph_label(graph, r"\frac{x^2}{4} + \frac{1}{2}", x_val=3.6)
        rectangles = axes.get_riemann_rectangles(
            graph, x_range=[1, 3], dx=0.25, fill_opacity=0.6
        )
        slope = axes.get_secant_slope_group(
            1.5, graph, dx=1, secant_line_color=m.YELLOW
        )
        self.play(m.Create(axes))
        self.play(m.Create(graph), m.Write(label))
        self.play(
            m.LaggedStart(
                *[m.GrowFromEdge(r, m.DOWN) for r in rectangles], lag_ratio=0.1
            )
        )
        self.play(m.FadeOut(rectangles), m.Create(slope))
        self.wait()
plot draws the graph of a Python function of x on axes, in their coordinates: it is a curve, a mobject as any other, to style and animate. The axes then make what explains it: a label at its end, the area under it, rectangles for its integral, its slope at a point, the graph of its derivative.
These methods make new mobjects, and add nothing: add them to the scene, or animate them.
Graphs
plot 
Code
import numpy as np

import manimgx as m


class AxesPlotExample(m.Scene):
    def construct(self) -> None:
        axes = m.Axes(x_range=[-4, 4], y_range=[-2, 2], y_length=6)
        sine = axes.plot(np.sin, color=m.BLUE)
        parabola = axes.plot(
            lambda x: x**2 - 1.5,
            x_range=[-1.8, 1.8],
            colorscale=[m.GREEN, m.YELLOW, m.RED],
        )
        self.add(axes)
        self.play(m.Create(sine), m.Create(parabola))
Plot the graph of a function y = f(x) on the axes, in their coordinates.
The function is sampled over x_range and the samples are joined smoothly (see
ParametricFunction); on a logarithmic x-axis, x
runs over powers. The graph keeps the function as its underlying_function,
for the methods that work on graphs. With a colorscale, the graph's stroke is
a gradient, from left to right, of the colors of its values (y, or x), taken at
every step of x_range (every 0.01 without one).
functionThe function, from x to y, in the axes' coordinates.
x_rangeThe range of x the graph spans,
[x_min, x_max]or[x_min, x_max, x_step], the function sampled everyx_step; None for the x-axis's range. Without a step, it is a tenth of the x-axis's.use_vectorizedWhether
functiontakes all the values of x at once, as an array; it is tried on an array anyway, and called once per value if it does not take one.colorscaleColors to paint the graph with by its value: colors spread evenly over the axis's range, or
(color, value)pairs, blended between; None for the graph's own color.colorscale_axisThe value the colorscale goes by: 1 for y, 0 for x.
dtHow far short of each discontinuity the curve's pieces stop, in units of its parameter (default 1e-8).
discontinuitiesThe values of the parameter where the curve breaks: it is drawn in pieces between them (default None: none).
use_smoothingWhether the samples are joined by a smooth curve through them, rather than by straight segments (default True).
colorThe color of both fill and stroke (default white); None for the class's default.
fill_colorThe fill's color;
colorif not given. Several colors make a gradient alongsheen_direction.fill_opacityThe fill's opacity, from 0 to 1 (default 0: no fill).
stroke_colorThe stroke's color;
colorif not given. Several colors make a gradient.stroke_opacityThe stroke's opacity, from 0 to 1 (default 1).
stroke_widthThe stroke's width, in hundredths of a scene unit (default 4; 0: no stroke).
background_stroke_colorThe color of an outline drawn behind the fill (default black).
background_stroke_opacityThe outline's opacity, from 0 to 1 (default 1).
background_stroke_widthThe outline's width, in hundredths of a scene unit (default 0: none).
sheen_factorHow much the colors lighten toward
sheen_direction, from -1 to 1 (default 0); a negative factor darkens.sheen_directionThe direction the colors lighten toward (default
UL).joint_typeHow the stroke is joined where its path turns: round, beveled or mitered, as a two-dimensional scene draws it (see LineJointType; default AUTO: mitered).
cap_styleHow the stroke ends, at each end it shows (an open path's, a dash's): round, butt or square, as a two-dimensional scene draws it (see CapStyleType; default AUTO: butt).
shade_in_3dWhether a three-dimensional scene's light shades the mobject.
materialHow its surface reflects the scene's lights in a three-dimensional scene (see Material); None: Manim's shading (default).
nameA name for the mobject; its class's name if not given.
z_indexIts place in the drawing order: a higher index is drawn over a lower one (default 0).
targetThe state
MoveToTargetmoves the mobject to.
Returns A new ParametricFunction, not added to the axes.
Source
src/manimgx/mobjects/plotting.py
1989 1990 1991 1992 1993 1994 1995 1996 1997 1998 1999 2000 2001 2002 2003 2004 2005 2006 2007 2008 2009 2010 2011 2012 2013 2014 2015 2016 2017 2018 2019 2020 2021 2022 2023 2024 2025 2026 2027 2028 2029 2030 2031 2032 2033 2034 2035 2036 2037 2038 2039 2040 2041 2042 2043 2044 2045 2046 2047 2048 2049 2050 2051 2052 2053 2054 2055 2056 2057 2058 2059 2060 2061 2062 2063 2064 2065 2066 2067 2068 2069 2070 2071 2072 2073 2074 2075 2076 | |
plot_line_graph 
Code
import manimgx as m


class AxesPlotLineGraphExample(m.Scene):
    def construct(self) -> None:
        axes = m.Axes(x_range=[0, 7], y_range=[0, 5], y_length=6)
        graph = axes.plot_line_graph(
            x_values=[0, 1.5, 2, 2.8, 4, 6.25],
            y_values=[1, 3, 2.25, 4, 2.5, 1.75],
            line_color=m.ORANGE,
            vertex_dot_radius=0.12,
            vertex_dot_style={"color": m.PURPLE},
            stroke_width=6,
        )
        self.add(axes.add_coordinates())
        self.play(m.Create(graph))
Plot a line graph: straight segments through points given by their
coordinates, with a dot at each point; bright yellow (PURE_YELLOW), with white
dots, unless styled. Empty inputs produce an empty graph.
x_valuesThe points' x coordinates.
y_valuesTheir y coordinates, as many.
z_valuesTheir z coordinates, on three-dimensional axes; None for 0.
line_colorThe line's color, unless the keywords give a
color.add_vertex_dotsWhether a dot marks each point.
vertex_dot_radiusThe dots' radius, in scene units.
vertex_dot_styleStyle keywords for the dots; None for none.
colorThe color of both fill and stroke (default white); None for the class's default.
fill_colorThe fill's color;
colorif not given. Several colors make a gradient alongsheen_direction.fill_opacityThe fill's opacity, from 0 to 1 (default 0: no fill).
stroke_colorThe stroke's color;
colorif not given. Several colors make a gradient.stroke_opacityThe stroke's opacity, from 0 to 1 (default 1).
stroke_widthThe stroke's width, in hundredths of a scene unit (default 4; 0: no stroke).
background_stroke_colorThe color of an outline drawn behind the fill (default black).
background_stroke_opacityThe outline's opacity, from 0 to 1 (default 1).
background_stroke_widthThe outline's width, in hundredths of a scene unit (default 0: none).
sheen_factorHow much the colors lighten toward
sheen_direction, from -1 to 1 (default 0); a negative factor darkens.sheen_directionThe direction the colors lighten toward (default
UL).joint_typeHow the stroke is joined where its path turns: round, beveled or mitered, as a two-dimensional scene draws it (see LineJointType; default AUTO: mitered).
cap_styleHow the stroke ends, at each end it shows (an open path's, a dash's): round, butt or square, as a two-dimensional scene draws it (see CapStyleType; default AUTO: butt).
shade_in_3dWhether a three-dimensional scene's light shades the mobject.
materialHow its surface reflects the scene's lights in a three-dimensional scene (see Material); None: Manim's shading (default).
nameA name for the mobject; its class's name if not given.
z_indexIts place in the drawing order: a higher index is drawn over a lower one (default 0).
targetThe state
MoveToTargetmoves the mobject to.
It also takes the style keywords.
Returns
A new VDict, not added to the axes, with the line
under "line_graph" and the dots, in a group, under "vertex_dots".
Source
src/manimgx/mobjects/plotting.py
2851 2852 2853 2854 2855 2856 2857 2858 2859 2860 2861 2862 2863 2864 2865 2866 2867 2868 2869 2870 2871 2872 2873 2874 2875 2876 2877 2878 2879 2880 2881 2882 2883 2884 2885 2886 2887 2888 2889 2890 2891 2892 2893 2894 2895 2896 2897 2898 2899 2900 2901 2902 2903 2904 2905 2906 2907 2908 2909 2910 2911 2912 2913 2914 2915 2916 2917 2918 2919 2920 2921 2922 2923 2924 2925 2926 2927 2928 | |
plot_polar_graph 
Plot a curve in polar coordinates, r = r_func(θ), on the axes: for each
angle θ of its range, the point in the direction θ from the origin, at the
distance r_func(θ).
r_funcThe function, from the angle θ, in radians, to the distance r, in the axes' units.
theta_rangeThe range of θ,
[θ_min, θ_max]or[θ_min, θ_max, θ_step], in radians, sampled every 0.01 without a step; None for a full turn, [0, 2π].dtHow far short of each discontinuity the curve's pieces stop, in units of its parameter (default 1e-8).
discontinuitiesThe values of the parameter where the curve breaks: it is drawn in pieces between them (default None: none).
use_smoothingWhether the samples are joined by a smooth curve through them, rather than by straight segments (default True).
colorThe color of both fill and stroke (default white); None for the class's default.
fill_colorThe fill's color;
colorif not given. Several colors make a gradient alongsheen_direction.fill_opacityThe fill's opacity, from 0 to 1 (default 0: no fill).
stroke_colorThe stroke's color;
colorif not given. Several colors make a gradient.stroke_opacityThe stroke's opacity, from 0 to 1 (default 1).
stroke_widthThe stroke's width, in hundredths of a scene unit (default 4; 0: no stroke).
background_stroke_colorThe color of an outline drawn behind the fill (default black).
background_stroke_opacityThe outline's opacity, from 0 to 1 (default 1).
background_stroke_widthThe outline's width, in hundredths of a scene unit (default 0: none).
sheen_factorHow much the colors lighten toward
sheen_direction, from -1 to 1 (default 0); a negative factor darkens.sheen_directionThe direction the colors lighten toward (default
UL).joint_typeHow the stroke is joined where its path turns: round, beveled or mitered, as a two-dimensional scene draws it (see LineJointType; default AUTO: mitered).
cap_styleHow the stroke ends, at each end it shows (an open path's, a dash's): round, butt or square, as a two-dimensional scene draws it (see CapStyleType; default AUTO: butt).
shade_in_3dWhether a three-dimensional scene's light shades the mobject.
materialHow its surface reflects the scene's lights in a three-dimensional scene (see Material); None: Manim's shading (default).
nameA name for the mobject; its class's name if not given.
z_indexIts place in the drawing order: a higher index is drawn over a lower one (default 0).
targetThe state
MoveToTargetmoves the mobject to.
Returns A new ParametricFunction, not added to the axes.
Source
src/manimgx/mobjects/plotting.py
plot_implicit_curve 
Plot the curve where a function of x and y is zero, func(x, y) = 0, on the
axes, in their coordinates: found within their ranges.
The rectangle of the ranges is divided in four, and each part in four again, finer where the curve passes (see ImplicitFunction). On a logarithmic axis, the function is given powers.
funcThe function of x and y, in the axes' coordinates.
min_depthHow many times the rectangle is at least divided in four: more finds smaller pieces of the curve.
max_quadsThe most cells the rectangle may be divided into: more follow the curve more closely, and take longer.
use_smoothingWhether the curve is smoothed through its points, rather than drawn in straight segments (default True).
colorThe color of both fill and stroke (default white); None for the class's default.
fill_colorThe fill's color;
colorif not given. Several colors make a gradient alongsheen_direction.fill_opacityThe fill's opacity, from 0 to 1 (default 0: no fill).
stroke_colorThe stroke's color;
colorif not given. Several colors make a gradient.stroke_opacityThe stroke's opacity, from 0 to 1 (default 1).
stroke_widthThe stroke's width, in hundredths of a scene unit (default 4; 0: no stroke).
background_stroke_colorThe color of an outline drawn behind the fill (default black).
background_stroke_opacityThe outline's opacity, from 0 to 1 (default 1).
background_stroke_widthThe outline's width, in hundredths of a scene unit (default 0: none).
sheen_factorHow much the colors lighten toward
sheen_direction, from -1 to 1 (default 0); a negative factor darkens.sheen_directionThe direction the colors lighten toward (default
UL).joint_typeHow the stroke is joined where its path turns: round, beveled or mitered, as a two-dimensional scene draws it (see LineJointType; default AUTO: mitered).
cap_styleHow the stroke ends, at each end it shows (an open path's, a dash's): round, butt or square, as a two-dimensional scene draws it (see CapStyleType; default AUTO: butt).
shade_in_3dWhether a three-dimensional scene's light shades the mobject.
materialHow its surface reflects the scene's lights in a three-dimensional scene (see Material); None: Manim's shading (default).
nameA name for the mobject; its class's name if not given.
z_indexIts place in the drawing order: a higher index is drawn over a lower one (default 0).
targetThe state
MoveToTargetmoves the mobject to.
Returns A new ImplicitFunction, not added to the axes.
Source
src/manimgx/mobjects/plotting.py
plot_derivative_graph 
Code
import manimgx as m


class AxesPlotDerivativeGraphExample(m.Scene):
    def construct(self) -> None:
        axes = m.Axes(x_range=[-3, 3], y_range=[-3, 4], y_length=6.5)
        cubic = axes.plot(lambda x: x**3 / 6 - x, color=m.BLUE)
        derivative = axes.plot_derivative_graph(cubic)
        labels = m.VGroup(
            axes.get_graph_label(cubic, "f(x)", x_val=-1.4, direction=m.UP),
            axes.get_graph_label(derivative, "f'(x)", x_val=2.5),
        )
        self.add(axes, cubic, labels[0])
        self.play(m.Create(derivative), m.FadeIn(labels[1]))
Plot the derivative of a graph: at each x, its slope; green unless styled.
It also takes
the plot keywords.
Returns A new ParametricFunction, not added to the axes.
Source
src/manimgx/mobjects/plotting.py
plot_antiderivative_graph 
Code
import manimgx as m


class AxesPlotAntiderivativeGraphExample(m.Scene):
    def construct(self) -> None:
        axes = m.Axes(x_range=[-3, 3], y_range=[-3, 3], y_length=6.5)
        graph = axes.plot(lambda x: (x**2 - 2) / 3, color=m.RED)
        antiderivative = axes.plot_antiderivative_graph(
            graph, y_intercept=1, color=m.BLUE
        )
        self.add(axes, graph)
        self.play(m.Create(antiderivative))
Plot an antiderivative of a graph: at each x, the integral of the graph from
0 to x, plus y_intercept.
Each value is a trapezoidal sum of the graph's values at samples points from
0 to x.
y_interceptThe antiderivative's value at 0.
samplesHow many of the graph's values each integral sums.
It also takes
the plot keywords.
Returns A new ParametricFunction, not added to the axes.
Source
src/manimgx/mobjects/plotting.py
Points on a graph
input_to_graph_point 
Code
import numpy as np

import manimgx as m


class AxesInputToGraphPointExample(m.Scene):
    def construct(self) -> None:
        axes = m.Axes(x_range=[0, 7], y_range=[-1.5, 1.5, 0.5])
        curve = axes.plot(np.cos, color=m.BLUE)
        dots = m.VGroup(
            *(m.Dot(axes.i2gp(x, curve), radius=0.12) for x in range(7))
        )
        self.add(axes, curve, dots.set_color(m.YELLOW))
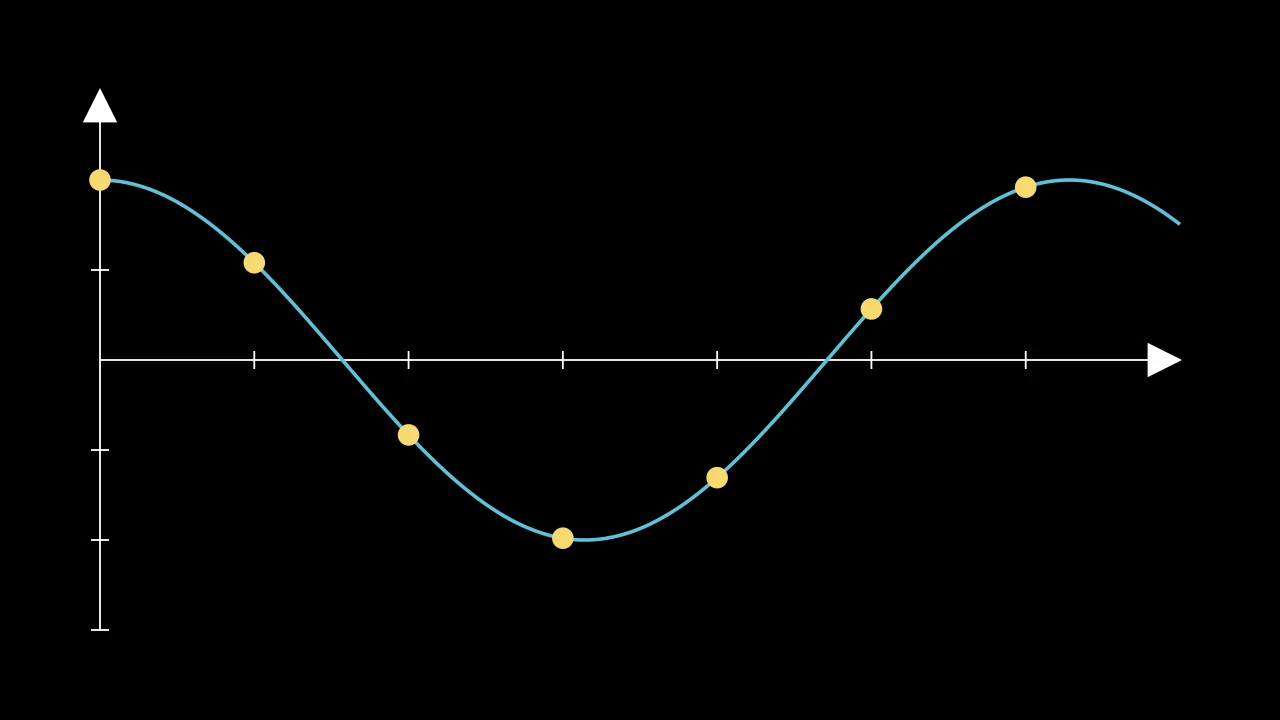
Find the point of a graph at an input: at x, for a graph of plot; at a value of its parameter, for another curve.
i2gp is its short name. The input may be past the graph's ends: the point is
then its function's, beyond what is drawn.
xThe input: x, in the axes' coordinates, for a graph.
graphThe graph, or curve.
Returns The point, in scene coordinates.
Source
src/manimgx/mobjects/plotting.py
i2gp 
input_to_graph_point, by a shorter name.
input_to_graph_coords 
Find the coordinates of a graph's point at an input: (x, f(x)), for a graph of plot; for another curve, those of its point at a value of its parameter.
xThe input: x, for a graph.
graphThe graph, or curve.
Returns The point's coordinates, (x, y).
Source
src/manimgx/mobjects/plotting.py
get_graph_label 
Code
import numpy as np

import manimgx as m


class AxesGetGraphLabelExample(m.Scene):
    def construct(self) -> None:
        axes = m.Axes(x_range=[-4, 4], y_range=[-2, 4], x_length=11)
        parabola = axes.plot(lambda x: x**2 / 4, color=m.BLUE)
        sine = axes.plot(np.sin, color=m.YELLOW)
        parabola_label = axes.get_graph_label(parabola, "x^2 / 4")
        sine_label = axes.get_graph_label(
            sine, r"\sin x", x_val=m.PI / 2, direction=m.UP, dot=True
        )
        self.add(axes, parabola, sine, parabola_label, sine_label)
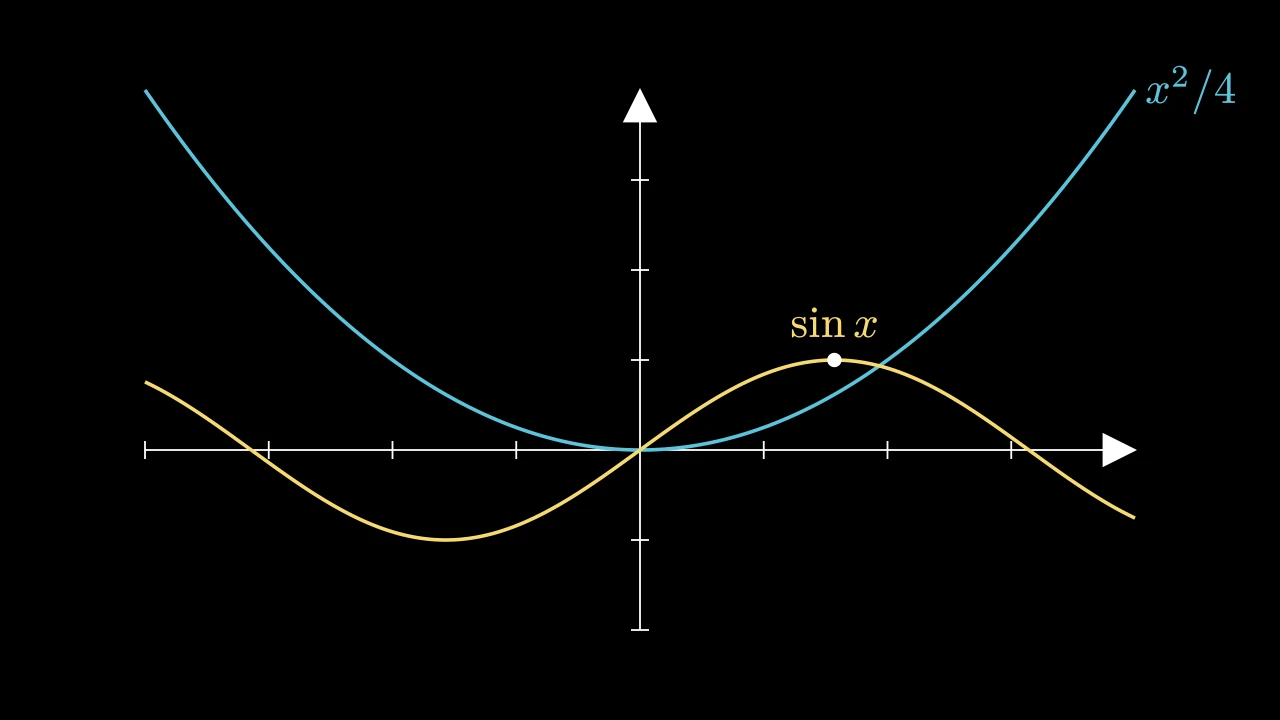
Make a label for a graph, by one of its points: in the graph's color, unless given another.
A string or a number is typeset with the axes' label_constructor (as math,
with MathTex, by default); a mobject is used as it is, and
recolored too. The label is put next to the graph's point at x_val, toward
direction, then moved onto the screen if it is off it. Without x_val, the
point is the rightmost, of a hundred over the x-axis's range, that is below the
top of the frame.
axes.get_graph_label(graph, label='f(x)', x_val=None, direction=RIGHT, buff=MED_SMALL_BUFF, color=None, dot=False, dot_config=None)
labelThe label: a string or a number, typeset as math, or a mobject.
x_valThe x of the point the label is put by; None for the rightmost on screen.
directionThe direction the label is put toward, from the point.
buffThe gap between the point and the label, in scene units.
colorThe label's color; None for the graph's.
dotWhether a dot marks the point, as part of the label.
dot_configStyle keywords for the dot; None for none.
Returns The label, not added to the axes.
Source
src/manimgx/mobjects/plotting.py
2253 2254 2255 2256 2257 2258 2259 2260 2261 2262 2263 2264 2265 2266 2267 2268 2269 2270 2271 2272 2273 2274 2275 2276 2277 2278 2279 2280 2281 2282 2283 2284 2285 2286 2287 2288 2289 2290 2291 2292 2293 2294 2295 2296 2297 2298 2299 2300 2301 2302 2303 2304 2305 2306 2307 2308 2309 2310 2311 2312 2313 2314 2315 2316 2317 2318 2319 2320 2321 2322 2323 | |
get_T_label 
Code
import numpy as np

import manimgx as m


class AxesGetTLabelExample(m.Scene):
    def construct(self) -> None:
        axes = m.Axes(x_range=[0, 10], y_range=[0, 10], y_length=6)
        graph = axes.plot(lambda x: 3 * np.sqrt(x), color=m.BLUE)
        t_label = axes.get_T_label(4, graph, label=m.MathTex("x = 4"))
        self.add(axes, graph)
        self.play(m.FadeIn(t_label))
Make a T-label for a value of x: a small triangle under the x-axis pointing up at the value, a label below the triangle, and a line from the x-axis up to the graph.
axes.get_T_label(x_val, graph, label=None, label_color=None, triangle_size=MED_SMALL_BUFF, triangle_color=WHITE, line_func=Line, line_color=PURE_YELLOW)
x_valThe value of x it marks.
graphThe graph the line reaches.
labelThe label below the triangle: a string or a number, typeset as math, or a mobject; None for none.
label_colorThe label's color; None to leave it as it is.
triangle_sizeThe triangle's height, in scene units.
triangle_colorThe triangle's color.
line_funcThe class of the line: Line (solid), DashedLine, ….
line_colorThe line's color.
Returns A new group of the label (if any), the triangle and the line; not added to the axes.
Source
src/manimgx/mobjects/plotting.py
2786 2787 2788 2789 2790 2791 2792 2793 2794 2795 2796 2797 2798 2799 2800 2801 2802 2803 2804 2805 2806 2807 2808 2809 2810 2811 2812 2813 2814 2815 2816 2817 2818 2819 2820 2821 2822 2823 2824 2825 2826 2827 2828 2829 2830 2831 2832 2833 2834 2835 2836 2837 2838 2839 2840 2841 2842 2843 2844 2845 2846 2847 2848 2849 | |
get_vertical_lines_to_graph 
Code
import numpy as np

import manimgx as m


class AxesGetVerticalLinesToGraphExample(m.Scene):
    def construct(self) -> None:
        axes = m.Axes(x_range=[0, 8], y_range=[-1, 1, 0.5], y_length=5)
        curve = axes.plot(
            lambda x: np.sin(2 * x) * np.exp(-x / 4), color=m.YELLOW
        )
        lines = axes.get_vertical_lines_to_graph(
            curve, x_range=[0.5, 7.5], num_lines=15, color=m.BLUE
        )
        self.add(axes, curve)
        self.play(m.Create(lines))
Make lines from the x-axis to a graph, evenly spaced over a range of x: dashed, white and thin unless styled.
x_rangeThe range of x,
[x_min, x_max]: the first line at x_min, the last at x_max; None for the x-axis's range.num_linesHow many lines.
line_funcThe class of the line (default DashedLine; a Line is solid).
line_configDashed line keywords for the line, but its color and width, which
colorandstroke_widthset (default None: none).colorThe line's color (default None: white).
stroke_widthThe line's width, in hundredths of a scene unit (default 2).
Returns A new group of the lines, from left to right; not added to the axes.
Source
src/manimgx/mobjects/plotting.py
Areas
get_area 
Code
import manimgx as m


class AxesGetAreaExample(m.Scene):
    def construct(self) -> None:
        axes = m.Axes(x_range=[0, 5], y_range=[0, 6], y_length=6.5)
        curve = axes.plot(lambda x: 5 - (x - 2.5) ** 2 / 2, color=m.BLUE)
        line = axes.plot(lambda x: x / 2, color=m.YELLOW)
        under = axes.get_area(curve, x_range=(0.5, 2))
        between = axes.get_area(
            curve, x_range=(3, 4.5), bounded_graph=line, color=m.RED
        )
        self.add(axes, under, between, curve, line)
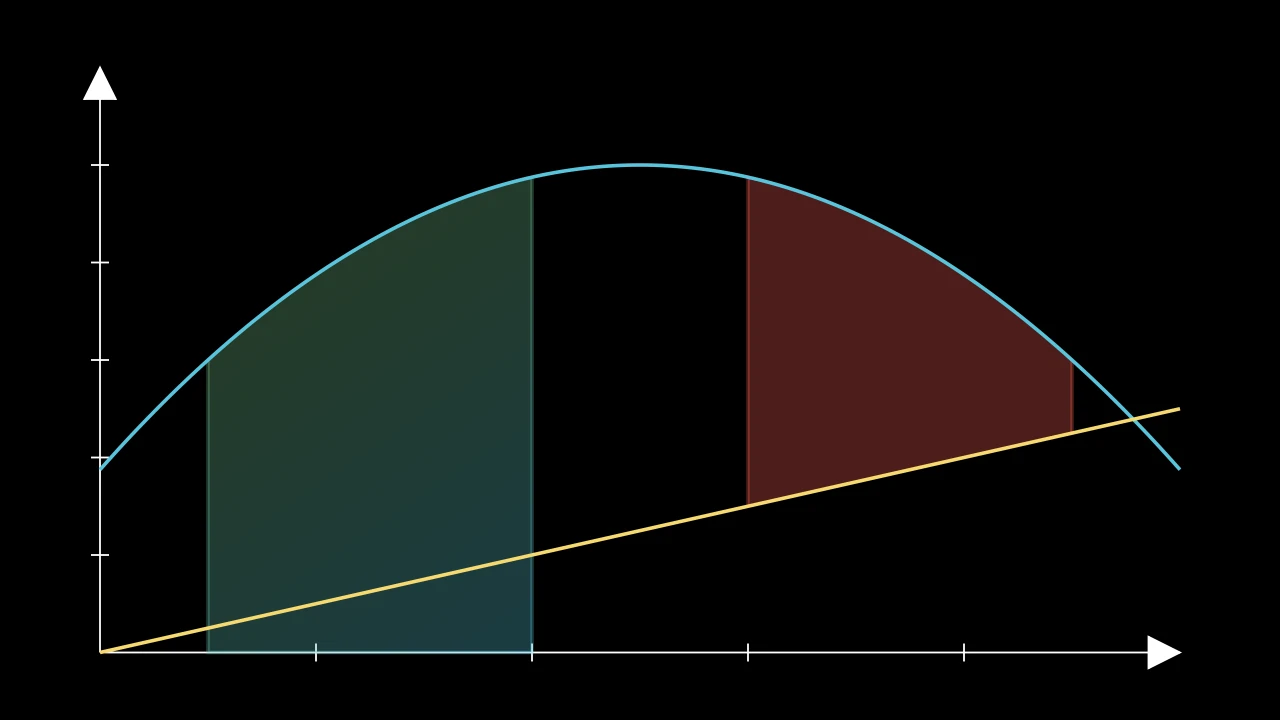
Make the area between a graph and the x-axis, or between two graphs, over a range of x: a polygon, blue to green and translucent unless styled.
The area's edge follows the graph's own points, and closes along the x-axis, or
back along bounded_graph; its fill and outline both take color and
opacity. Two graphs whose ranges do not meet raise a ValueError.
x_rangeThe range of x,
(x_min, x_max); None for the graph's.colorThe area's color, or colors for a gradient.
opacityThe area's opacity, from 0 to 1.
bounded_graphA second graph the area reaches to, rather than the x-axis; None for the x-axis. Only the range both graphs span is covered.
fill_colorThe fill's color;
colorif not given. Several colors make a gradient alongsheen_direction.fill_opacityThe fill's opacity, from 0 to 1 (default 0: no fill).
stroke_colorThe stroke's color;
colorif not given. Several colors make a gradient.stroke_opacityThe stroke's opacity, from 0 to 1 (default 1).
stroke_widthThe stroke's width, in hundredths of a scene unit (default 4; 0: no stroke).
background_stroke_colorThe color of an outline drawn behind the fill (default black).
background_stroke_opacityThe outline's opacity, from 0 to 1 (default 1).
background_stroke_widthThe outline's width, in hundredths of a scene unit (default 0: none).
sheen_factorHow much the colors lighten toward
sheen_direction, from -1 to 1 (default 0); a negative factor darkens.sheen_directionThe direction the colors lighten toward (default
UL).joint_typeHow the stroke is joined where its path turns: round, beveled or mitered, as a two-dimensional scene draws it (see LineJointType; default AUTO: mitered).
cap_styleHow the stroke ends, at each end it shows (an open path's, a dash's): round, butt or square, as a two-dimensional scene draws it (see CapStyleType; default AUTO: butt).
shade_in_3dWhether a three-dimensional scene's light shades the mobject.
materialHow its surface reflects the scene's lights in a three-dimensional scene (see Material); None: Manim's shading (default).
nameA name for the mobject; its class's name if not given.
z_indexIts place in the drawing order: a higher index is drawn over a lower one (default 0).
targetThe state
MoveToTargetmoves the mobject to.
It also takes the style keywords.
Returns A new Polygon, not added to the axes.
Source
src/manimgx/mobjects/plotting.py
2441 2442 2443 2444 2445 2446 2447 2448 2449 2450 2451 2452 2453 2454 2455 2456 2457 2458 2459 2460 2461 2462 2463 2464 2465 2466 2467 2468 2469 2470 2471 2472 2473 2474 2475 2476 2477 2478 2479 2480 2481 2482 2483 2484 2485 2486 2487 2488 2489 2490 2491 2492 2493 2494 2495 2496 2497 2498 2499 2500 2501 2502 2503 2504 2505 2506 2507 2508 2509 2510 2511 2512 | |
get_riemann_rectangles 
Code
import manimgx as m


class AxesGetRiemannRectanglesExample(m.Scene):
    def construct(self) -> None:
        axes = m.Axes(x_range=[-3, 3], y_range=[-2, 4], y_length=6.5)
        graph = axes.plot(lambda x: x**2 / 2 - 1, color=m.YELLOW)
        coarse, fine = (
            axes.get_riemann_rectangles(graph, x_range=[-2.5, 2.5], dx=dx)
            for dx in (0.5, 0.1)
        )
        self.add(axes, coarse, graph)
        self.play(m.Transform(coarse, fine), run_time=2)
Make Riemann rectangles for a graph: from the x-axis (or a second graph) up
to the graph, dx wide, their colors a gradient; outlined thinly in black
unless styled.
A rectangle begins at every dx from the start of x_range, the last before
its end. Each rises from the x-axis — or from bounded_graph, at its left
edge — to the graph at its left edge, its right edge or its center
(input_sample_type). With show_signed_area, a rectangle where the graph is
below its base takes the inverse of its color.
graphThe graph, of plot.
x_rangeThe range of x the rectangles cover,
[x_min, x_max]; None for the graph's (andbounded_graph's, where both are).dxThe rectangles' width, in the axes' units.
input_sample_typeWhere each rectangle meets the graph:
"left","right"or"center".stroke_widthThe width of the rectangles' outlines, in hundredths of a scene unit.
stroke_colorThe outlines' color (unless
blend).fill_opacityThe rectangles' opacity, from 0 to 1.
colorThe rectangles' color, or colors for a gradient from the first rectangle to the last.
show_signed_areaWhether a rectangle where the graph is below its base takes the inverse of its color.
bounded_graphA second graph, of plot, the rectangles rise from; None for the x-axis.
blendWhether each outline takes its rectangle's color, rather than
stroke_color.width_scale_factorHow much wider than
dxeach rectangle is made, so that neighbours meet without a seam.
Returns A new group of the rectangles, from left to right; not added to the axes.
Source
src/manimgx/mobjects/plotting.py
2325 2326 2327 2328 2329 2330 2331 2332 2333 2334 2335 2336 2337 2338 2339 2340 2341 2342 2343 2344 2345 2346 2347 2348 2349 2350 2351 2352 2353 2354 2355 2356 2357 2358 2359 2360 2361 2362 2363 2364 2365 2366 2367 2368 2369 2370 2371 2372 2373 2374 2375 2376 2377 2378 2379 2380 2381 2382 2383 2384 2385 2386 2387 2388 2389 2390 2391 2392 2393 2394 2395 2396 2397 2398 2399 2400 2401 2402 2403 2404 2405 2406 2407 2408 2409 2410 2411 2412 2413 2414 2415 2416 2417 2418 2419 2420 2421 2422 2423 2424 2425 2426 2427 2428 2429 2430 2431 2432 2433 2434 2435 2436 2437 2438 2439 | |
Slopes
slope_of_tangent 
Find the slope of a graph's tangent at an input: its derivative, dy/dx, in the axes' coordinates.
It is the tangent of angle_of_tangent's angle.
xThe input: x, for a graph of plot.
dxThe step the tangent is taken over, in the axes' units.
Source
src/manimgx/mobjects/plotting.py
angle_of_tangent 
Find the angle of a graph's tangent at an input, in the axes' coordinates.
The tangent is taken from the graph's point at x to its point at x + dx.
xThe input: x, for a graph of plot.
dxThe step the tangent is taken over, in the axes' units.
Returns The angle, in radians, counterclockwise from the direction of the x-axis, measured in the axes' coordinates: not as drawn, where their units differ.
Source
src/manimgx/mobjects/plotting.py
get_secant_slope_group 
Code
import manimgx as m


class AxesGetSecantSlopeGroupExample(m.Scene):
    def construct(self) -> None:
        axes = m.Axes(x_range=[0, 5], y_range=[0, 7], y_length=6.5)
        graph = axes.plot(lambda x: x**2 / 4, color=m.BLUE)
        secant = axes.get_secant_slope_group(
            2,
            graph,
            dx=2,
            dx_label="dx",
            dy_label="dy",
            secant_line_length=7,
            secant_line_color=m.RED,
        )
        self.add(axes, graph)
        self.play(m.Create(secant))
Make a secant's construction on a graph, between its points at x and
x + dx: the legs dx and df, their labels, and the secant through both points.
The dx leg runs across from the first point, and the df leg up (or down) to the
second, in the graph's color unless given another. The labels, typeset as math
unless mobjects, are scaled down together to fit their legs (to 80% of the dx
leg's width and of the df leg's height), and put below the dx leg and right of
the df leg (above and left, for a negative dx), each in its leg's color. The
secant is secant_line_length long, centered between the points.
xThe input of the first point: its x.
dxThe step to the second point, in the axes' units; None for a tenth of the x-axis's range.
dx_line_colorThe dx leg's color.
dy_line_colorThe df leg's color; None for the graph's.
dx_labelThe dx leg's label: a string, a number or a mobject; None for none.
dy_labelThe df leg's label, likewise; None for none.
include_secant_lineWhether the construction includes the secant.
secant_line_colorThe secant's color.
secant_line_lengthThe secant's length, in scene units.
Returns
A new SecantSlopeGroup,
not added to the axes: its parts are its dx_line, df_line, dx_label,
df_label and secant_line.
Source
src/manimgx/mobjects/plotting.py
2634 2635 2636 2637 2638 2639 2640 2641 2642 2643 2644 2645 2646 2647 2648 2649 2650 2651 2652 2653 2654 2655 2656 2657 2658 2659 2660 2661 2662 2663 2664 2665 2666 2667 2668 2669 2670 2671 2672 2673 2674 2675 2676 2677 2678 2679 2680 2681 2682 2683 2684 2685 2686 2687 2688 2689 2690 2691 2692 2693 2694 2695 2696 2697 2698 2699 2700 2701 2702 2703 2704 2705 2706 2707 2708 2709 2710 2711 2712 2713 2714 2715 2716 2717 2718 2719 2720 2721 2722 2723 2724 2725 2726 2727 2728 2729 2730 2731 2732 2733 2734 2735 2736 | |
SecantSlopeGroup 
A secant's construction, as get_secant_slope_group makes it: its dx and df legs, their labels and the secant line, each by name.
dx_line 
The horizontal leg: from the first point of the graph across to below (or above) the second.
df_line 
The vertical leg: from the end of dx_line to the second point.
dx_label 
The horizontal leg's label, if it has one.
df_label 
The vertical leg's label, if it has one.
secant_line 
The secant: the line through both points, if it has one.