Curves
The film's code
import manimgx as m
import numpy as np


def heart(t: float) -> np.ndarray:
    x = 16 * np.sin(t) ** 3
    y = 13 * np.cos(t) - 5 * np.cos(2 * t) - 2 * np.cos(3 * t) - np.cos(4 * t)
    return np.array([x, y, 0]) / 6


class CurvesHero(m.Scene):
    def construct(self) -> None:
        graph = m.FunctionGraph(np.sin, x_range=[-6, -1], color=m.BLUE)
        curve = m.ParametricFunction(heart, t_range=[0, 2 * np.pi], color=m.RED)
        circle = m.ImplicitFunction(
            lambda x, y: (x - 4) ** 2 + y**2 - 2.25, color=m.YELLOW
        )
        self.play(m.Create(graph), m.Create(curve), m.Create(circle), run_time=3)
        self.wait()
These curves are drawn in the frame's own coordinates: the graph of sin passes through
the point [0, 0, 0] of the frame. To draw a graph on axes, in their coordinates, use
axes.plot, which makes one of these for you.
FunctionGraph 
Code
import numpy as np

import manimgx as m


class FunctionGraphExample(m.Scene):
    def construct(self) -> None:
        wave = m.FunctionGraph(
            lambda x: np.sin(x) + 0.5 * np.sin(7 * x) + np.sin(14 * x) / 7,
            color=m.BLUE,
        )
        bell = m.FunctionGraph(
            lambda x: 3 * np.exp(-(x**2)), x_range=[-4, 4], color=m.YELLOW
        )
        self.play(m.Create(wave), m.Create(bell), run_time=2)
The graph of a function y = f(x), in scene coordinates: the points (x, f(x), 0),
joined smoothly; bright yellow (PURE_YELLOW) unless styled.
The sampler may call the function with arrays and individual values, falling back to scalar evaluation when needed. The number of callback calls is not guaranteed.
To graph a function on axes, in their coordinates, see plot.
functionThe function, from x to y.
x_rangeThe range of x,
[x_min, x_max]or[x_min, x_max, x_step]; the step is 0.01 if not given. None for the frame's width.colorThe color of both fill and stroke (default white); None for the class's default.
fill_colorThe fill's color;
colorif not given. Several colors make a gradient alongsheen_direction.fill_opacityThe fill's opacity, from 0 to 1 (default 0: no fill).
stroke_colorThe stroke's color;
colorif not given. Several colors make a gradient.stroke_opacityThe stroke's opacity, from 0 to 1 (default 1).
stroke_widthThe stroke's width, in hundredths of a scene unit (default 4; 0: no stroke).
background_stroke_colorThe color of an outline drawn behind the fill (default black).
background_stroke_opacityThe outline's opacity, from 0 to 1 (default 1).
background_stroke_widthThe outline's width, in hundredths of a scene unit (default 0: none).
sheen_factorHow much the colors lighten toward
sheen_direction, from -1 to 1 (default 0); a negative factor darkens.sheen_directionThe direction the colors lighten toward (default
UL).joint_typeHow the stroke is joined where its path turns: round, beveled or mitered, as a two-dimensional scene draws it (see LineJointType; default AUTO: mitered).
cap_styleHow the stroke ends, at each end it shows (an open path's, a dash's): round, butt or square, as a two-dimensional scene draws it (see CapStyleType; default AUTO: butt).
shade_in_3dWhether a three-dimensional scene's light shades the mobject.
materialHow its surface reflects the scene's lights in a three-dimensional scene (see Material); None: Manim's shading (default).
nameA name for the mobject; its class's name if not given.
z_indexIts place in the drawing order: a higher index is drawn over a lower one (default 0).
targetThe state
MoveToTargetmoves the mobject to.
It also takes the style keywords.
Source
src/manimgx/mobjects/plotting.py
ParametricFunction 
Code
import numpy as np

import manimgx as m


class ParametricFunctionExample(m.Scene):
    def construct(self) -> None:
        lissajous = m.ParametricFunction(
            lambda t: np.array([2.5 * np.sin(2 * t), 2.5 * np.sin(3 * t), 0]),
            t_range=[0, m.TAU],
            color=m.BLUE,
        )
        spiral = m.ParametricFunction(
            lambda t: np.array([0.15 * t * np.cos(t), 0.15 * t * np.sin(t), 0]),
            t_range=[0, 3 * m.TAU],
            color=m.YELLOW,
        )
        curves = m.VGroup(lissajous, spiral).arrange(buff=1.5)
        self.play(m.Create(curves), run_time=3)
A parametric curve: the points function(t) for t from t_min to t_max,
joined smoothly; white unless styled.
The function is sampled every t_step, and at t_max, and the samples are joined
by a smooth curve through them (or by straight segments, without
use_smoothing). Where the function jumps, give its discontinuities: the curve
is drawn in pieces between them, each stopping dt short. Unless
use_vectorized, the function is first tried on all the values of t at once, as
an array, and checked against single calls; a function that does not take arrays
is called once per value.
The discontinuities are kept as the list they were when the curve was made, before range filtering, so copies and regenerated curves keep all its breaks.
To graph a function on axes, in their coordinates, see plot.
functionThe function, from t to a point in scene coordinates: its x, y and z.
t_rangeThe range of t,
[t_min, t_max]or[t_min, t_max, t_step]; the step is 0.01 if not given.scalingHow t is spaced over its range: evenly, with LinearBase; with LogBase, the range is of exponents, and t runs over powers.
dtHow far short of each discontinuity the pieces stop, in units of t.
discontinuitiesThe values of t where the curve breaks; None for none.
use_smoothingWhether the samples are joined by a smooth curve through them, rather than by straight segments.
use_vectorizedWhether
functiontakes all the values of t at once, as an array, and returns the arrays of x, y and z (a z that is not an array is taken as 0).colorThe color of both fill and stroke (default white); None for the class's default.
fill_colorThe fill's color;
colorif not given. Several colors make a gradient alongsheen_direction.fill_opacityThe fill's opacity, from 0 to 1 (default 0: no fill).
stroke_colorThe stroke's color;
colorif not given. Several colors make a gradient.stroke_opacityThe stroke's opacity, from 0 to 1 (default 1).
stroke_widthThe stroke's width, in hundredths of a scene unit (default 4; 0: no stroke).
background_stroke_colorThe color of an outline drawn behind the fill (default black).
background_stroke_opacityThe outline's opacity, from 0 to 1 (default 1).
background_stroke_widthThe outline's width, in hundredths of a scene unit (default 0: none).
sheen_factorHow much the colors lighten toward
sheen_direction, from -1 to 1 (default 0); a negative factor darkens.sheen_directionThe direction the colors lighten toward (default
UL).joint_typeHow the stroke is joined where its path turns: round, beveled or mitered, as a two-dimensional scene draws it (see LineJointType; default AUTO: mitered).
cap_styleHow the stroke ends, at each end it shows (an open path's, a dash's): round, butt or square, as a two-dimensional scene draws it (see CapStyleType; default AUTO: butt).
shade_in_3dWhether a three-dimensional scene's light shades the mobject.
materialHow its surface reflects the scene's lights in a three-dimensional scene (see Material); None: Manim's shading (default).
nameA name for the mobject; its class's name if not given.
z_indexIts place in the drawing order: a higher index is drawn over a lower one (default 0).
targetThe state
MoveToTargetmoves the mobject to.
It also takes the style keywords.
Source
src/manimgx/mobjects/plotting.py
underlying_function 
The function y = f(x) the curve is the graph of, if it is one: plot and FunctionGraph set it. None for other curves.
function 
The curve's function: from t to its point, as an array.
get_function 
The curve's function: from t to its point.
Returns The function, which returns an array.
get_point_from_function 
The curve's point at a value of t, from its function: past t_range too.
tThe value of t.
Returns The point, in scene coordinates.
Source
src/manimgx/mobjects/plotting.py
ImplicitFunction 
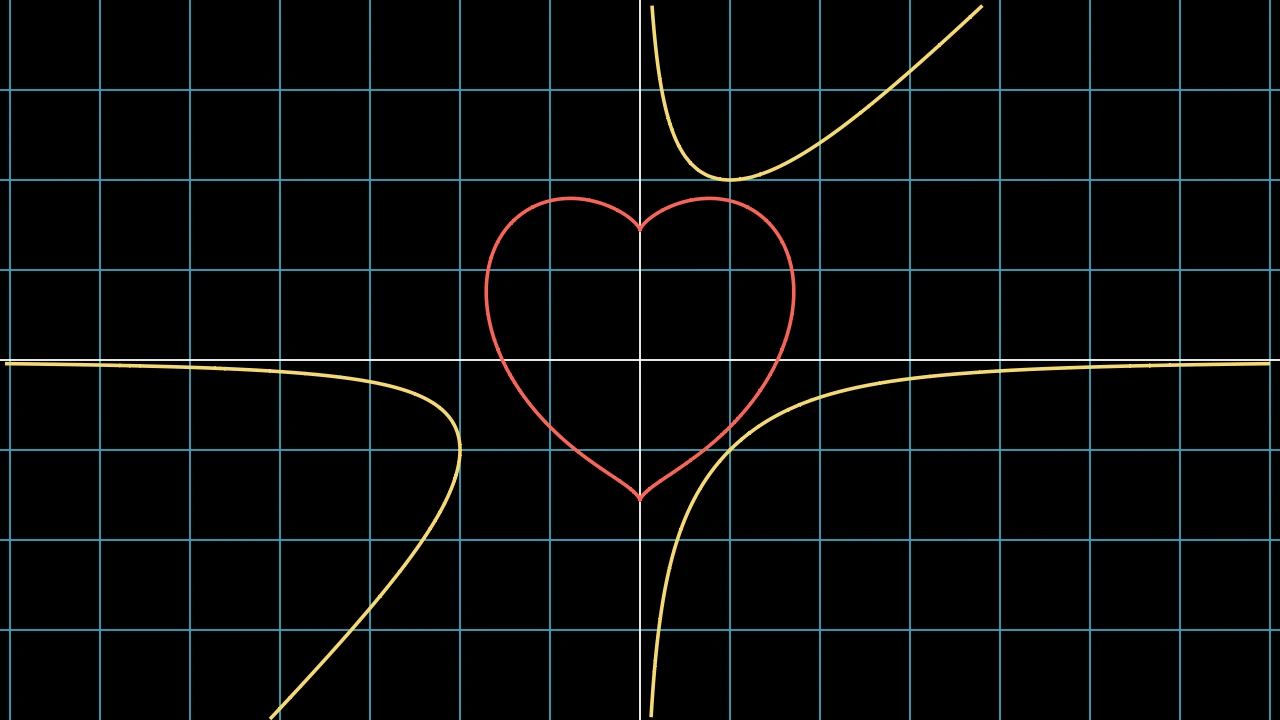
Code
import manimgx as m


class ImplicitFunctionExample(m.Scene):
    def construct(self) -> None:
        cubic = m.ImplicitFunction(
            lambda x, y: x * y**2 - x**2 * y - 2, color=m.YELLOW
        )
        heart = m.ImplicitFunction(
            lambda x, y: (x**2 + y**2 - 1) ** 3 - x**2 * y**3,
            x_range=[-1.5, 1.5],
            y_range=[-1.5, 1.5],
            color=m.RED,
        ).scale(1.5)
        self.add(m.NumberPlane(), cubic, heart)
The curve where a function of x and y is zero, func(x, y) = 0, in scene
coordinates, found within a rectangle; white unless styled.
The rectangle is divided in four, and each part in four again, finer where the curve passes, and the curve is traced through the cells: one path for each of its pieces. To plot on axes, in their coordinates, see plot_implicit_curve.
funcThe function of x and y, in scene coordinates.
x_rangeThe range of x to look in,
[x_min, x_max]; None for the frame's width.y_rangeThe range of y to look in,
[y_min, y_max]; None for the frame's height.min_depthHow many times the rectangle is at least divided in four: more finds smaller pieces of the curve.
max_quadsThe most cells the rectangle may be divided into: more follow the curve more closely, and take longer.
use_smoothingWhether the curve is smoothed through its points, rather than drawn in straight segments.
colorThe color of both fill and stroke (default white); None for the class's default.
fill_colorThe fill's color;
colorif not given. Several colors make a gradient alongsheen_direction.fill_opacityThe fill's opacity, from 0 to 1 (default 0: no fill).
stroke_colorThe stroke's color;
colorif not given. Several colors make a gradient.stroke_opacityThe stroke's opacity, from 0 to 1 (default 1).
stroke_widthThe stroke's width, in hundredths of a scene unit (default 4; 0: no stroke).
background_stroke_colorThe color of an outline drawn behind the fill (default black).
background_stroke_opacityThe outline's opacity, from 0 to 1 (default 1).
background_stroke_widthThe outline's width, in hundredths of a scene unit (default 0: none).
sheen_factorHow much the colors lighten toward
sheen_direction, from -1 to 1 (default 0); a negative factor darkens.sheen_directionThe direction the colors lighten toward (default
UL).joint_typeHow the stroke is joined where its path turns: round, beveled or mitered, as a two-dimensional scene draws it (see LineJointType; default AUTO: mitered).
cap_styleHow the stroke ends, at each end it shows (an open path's, a dash's): round, butt or square, as a two-dimensional scene draws it (see CapStyleType; default AUTO: butt).
shade_in_3dWhether a three-dimensional scene's light shades the mobject.
materialHow its surface reflects the scene's lights in a three-dimensional scene (see Material); None: Manim's shading (default).
nameA name for the mobject; its class's name if not given.
z_indexIts place in the drawing order: a higher index is drawn over a lower one (default 0).
targetThe state
MoveToTargetmoves the mobject to.
It also takes the style keywords.
Source
src/manimgx/mobjects/plotting.py
function 
The function whose zeros the curve is.