Skip to content

Charts

The film's code
import manimgx as m


class ChartsHero(m.Scene):
    def construct(self) -> None:
        chart = m.BarChart(
            [3, 5, 2, 6, 4], bar_names=["A", "B", "C", "D", "E"], y_range=[0, 8, 2]
        )
        self.play(m.Create(chart))
        self.play(chart.animate.change_bar_values([5, 2, 6, 3, 7]), run_time=2)
        self.wait()

A bar chart is axes with a bar for each value, which grow and shrink as the values change. A sample space is a rectangle that stands for all the outcomes of a chance: divide it into parts whose areas are their probabilities.

BarChart

BarChartExample
Code
import manimgx as m


class BarChartExample(m.Scene):
    def construct(self) -> None:
        chart = m.BarChart(
            values=[-5, 40, -10, 20, -3],
            bar_names=["one", "two", "three", "four", "five"],
            y_range=[-20, 50, 10],
            x_length=10,
            y_length=6,
            x_axis_config={"font_size": 36},
        )
        self.add(chart)

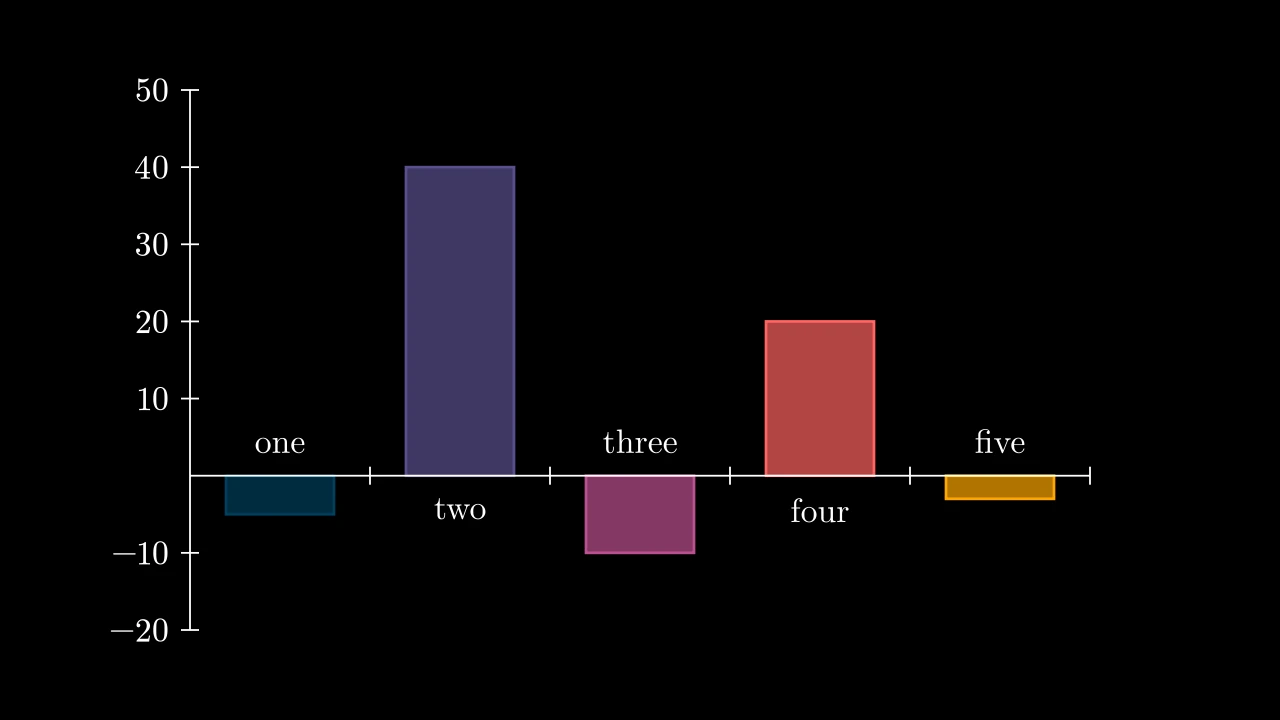
A bar chart: a bar for each value, rising from the x-axis (or hanging below it, for a negative value), on axes with a numbered y-axis; the bars colored along a gradient.

Each bar stands in its own unit of the x-axis, centered in it and bar_width of it wide, and it is as tall as its value, in the y-axis's units. The bars' names go below the x-axis (above it, under a negative bar). change_bar_values changes the bars, and get_bar_labels writes their values beside them. The chart is Axes: its x-axis runs from 0 to the number of bars.

m.BarChart(values, bar_names=None, y_range=None, x_length=None, y_length=None, bar_colors=('#003f5c', '#58508d', '#bc5090', '#ff6361', '#ffa600'), bar_width=0.6, bar_fill_opacity=0.7, bar_stroke_width=3, **kwargs)
values

The values, one bar each, from left to right.

bar_names

The bars' names, written by the x-axis, typeset as text; None for none.

y_range

The y-axis's range, [y_min, y_max, y_step]; None to fit the values, from 0 (or the lowest value, if negative) to the highest (or 0), with a step of about one scene unit. Given two numbers, the step is that one.

x_length

The x-axis's length, in scene units; None for one scene unit per bar, at most the frame's width less 2.

y_length

The y-axis's length, in scene units; None for 4, the frame's height less 4.

bar_colors

The bars' colors: a gradient over them, from left to right.

bar_width

Each bar's width, as a fraction of its unit of the x-axis.

bar_fill_opacity

The bars' fill opacity, from 0 to 1.

bar_stroke_width

The width of the bars' outlines, in hundredths of a scene unit.

It also takes the Axes keywords.

Source

src/manimgx/mobjects/plotting.py

def __init__(
    self,
    values: Sequence[float],
    bar_names: Sequence[str] | None = None,
    y_range: Sequence[float] | None = None,
    x_length: float | None = None,
    y_length: float | None = None,
    bar_colors: Iterable[ParsableManimColor] = (
        "#003f5c",
        "#58508d",
        "#bc5090",
        "#ff6361",
        "#ffa600",
    ),
    bar_width: float = 0.6,
    bar_fill_opacity: float = 0.7,
    bar_stroke_width: float = 3,
    **kwargs: Unpack[AxesOptions],
):
    y_length = y_length if y_length is not None else config.frame_height - 4
    self.values = list(values)
    """The chart's values, one per bar, as they are now."""
    self.bar_names = bar_names
    self.bar_colors = list(bar_colors)
    self.bar_width = bar_width
    self.bar_fill_opacity = bar_fill_opacity
    self.bar_stroke_width = bar_stroke_width
    x_range = [0, len(self.values), 1]
    if y_range is None:
        y_range = [
            min(0, min(self.values)),
            max(0, max(self.values)),
            round(max(self.values) / y_length, 2),
        ]
    elif len(y_range) == 2:
        y_range = [*y_range, round(max(self.values) / y_length, 2)]
    if x_length is None:
        x_length = min(len(self.values), config.frame_width - 2)
    kwargs["x_axis_config"] = merged_axis_config(
        {"font_size": 24, "label_constructor": Tex}, kwargs.get("x_axis_config")
    )
    kwargs.setdefault("tips", False)
    self.bars: VGroup = VGroup()
    """The bars, rectangles, from left to right."""
    self.x_labels: VGroup | None = None
    self.bar_labels: VGroup | None = None
    super().__init__(
        x_range=x_range,
        y_range=y_range,
        x_length=x_length,
        y_length=y_length,
        **kwargs,
    )
    self._add_bars()
    if self.bar_names is not None:
        self._add_x_axis_labels()
    self.y_axis.add_numbers()

values

The chart's values, one per bar, as they are now.

bars

The bars, rectangles, from left to right.

get_bar_labels

BarChartGetBarLabelsExample
Code
import manimgx as m


class BarChartGetBarLabelsExample(m.Scene):
    def construct(self) -> None:
        chart = m.BarChart(
            values=[9, 7, 4, 3, 1],
            y_range=[0, 10, 2],
            x_length=10,
            y_length=5,
            bar_colors=[m.BLUE, m.GREEN, m.YELLOW],
        )
        self.add(chart, chart.get_bar_labels(font_size=40))

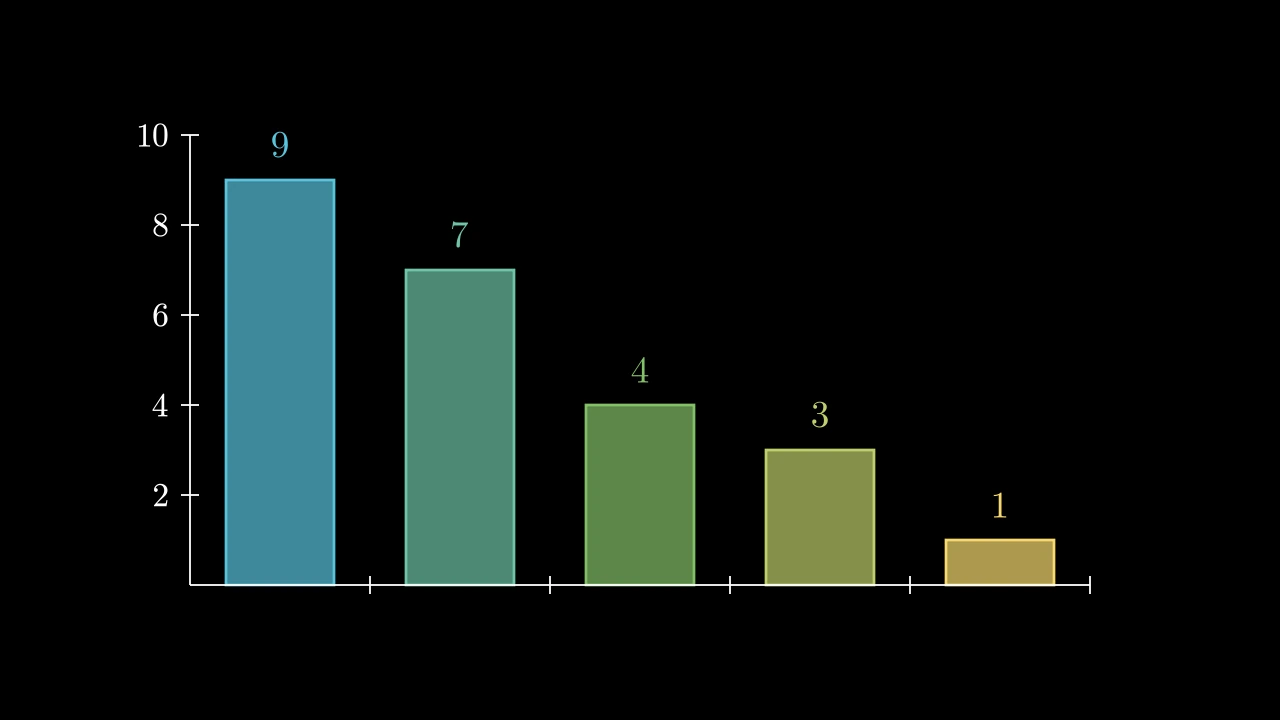
Make labels of the bars' values: each above its bar (below it, for a negative value), in the bar's color unless given another.

bar_chart.get_bar_labels(color=None, font_size=24, buff=MED_SMALL_BUFF, label_constructor=Tex)
color

The labels' color; None for each bar's fill color.

font_size

Their font size.

buff

The gap between each bar and its label, in scene units.

label_constructor

The class they are typeset with: Tex, MathTex, ….

Returns A new group of the labels, from left to right, not added to the chart.

Source

src/manimgx/mobjects/plotting.py

def get_bar_labels(
    self,
    color: ParsableManimColor | None = None,
    font_size: float = 24,
    buff: float = MED_SMALL_BUFF,
    label_constructor: type[ManimTextLabel] = Tex,
) -> VGroup:
    """Make labels of the bars' values: each above its bar (below it, for a
    negative value), in the bar's color unless given another.

    Args:
        color: The labels' color; None for each bar's fill color.
        font_size: Their font size.
        buff: The gap between each bar and its label, in scene units.
        label_constructor: The class they are typeset with: [Tex][manimgx.Tex],
            [MathTex][manimgx.MathTex], ….

    Returns:
        A new group of the labels, from left to right, not added to the chart.

    Examples:
        ```python
        import manimgx as m


        class BarChartGetBarLabelsExample(m.Scene):
            def construct(self) -> None:
                chart = m.BarChart(
                    values=[9, 7, 4, 3, 1],
                    y_range=[0, 10, 2],
                    x_length=10,
                    y_length=5,
                    bar_colors=[m.BLUE, m.GREEN, m.YELLOW],
                )
                self.add(chart, chart.get_bar_labels(font_size=40))
        ```
    """
    bar_labels = VGroup()
    for bar, value in zip(self.bars, self.values, strict=False):
        bar_lbl = label_constructor(str(value))
        if color is None:
            bar_lbl.set_color(bar.get_fill_color())
        else:
            bar_lbl.set_color(color)
        bar_lbl.font_size = font_size
        pos = UP if value >= 0 else DOWN
        bar_lbl.next_to(bar, pos, buff=buff)
        bar_labels.add(bar_lbl)
    return bar_labels

change_bar_values

Code
import manimgx as m


class BarChartChangeBarValuesExample(m.Scene):
    def construct(self) -> None:
        chart = m.BarChart(
            values=[4, 8, 2, 6], y_range=[-4, 8, 2], x_length=9, y_length=6
        )
        self.add(chart)
        self.play(chart.animate.change_bar_values([7, -3, 5, 1]))

Change the bars' values: each bar is stretched to its new height from the x-axis, crossing to its other side if the value changes sign.

The y-axis stays as it is, and labels made before do not follow; to animate the change, use .animate.

bar_chart.change_bar_values(values, update_colors=True)
values

The new values, from left to right; fewer than the bars change the first ones only.

update_colors

Whether to color the bars along the chart's gradient again (a bar remade from a value of 0 needs it).

Source

src/manimgx/mobjects/plotting.py

def change_bar_values(
    self, values: Iterable[float], update_colors: bool = True
) -> Self:
    """Change the bars' values: each bar is stretched to its new height from the
    x-axis, crossing to its other side if the value changes sign.

    The y-axis stays as it is, and labels made before do not follow; to animate the
    change, use `.animate`.

    Args:
        values: The new values, from left to right; fewer than the bars change the
            first ones only.
        update_colors: Whether to color the bars along the chart's gradient again (a
            bar remade from a value of 0 needs it).

    Examples:
        ```python
        import manimgx as m


        class BarChartChangeBarValuesExample(m.Scene):
            def construct(self) -> None:
                chart = m.BarChart(
                    values=[4, 8, 2, 6], y_range=[-4, 8, 2], x_length=9, y_length=6
                )
                self.add(chart)
                self.play(chart.animate.change_bar_values([7, -3, 5, 1]))
        ```
    """
    values = list(values)
    # the bars as they are: a bar remade below takes its place in `self.bars`
    for i, (bar, value) in enumerate(zip(list(self.bars), values, strict=False)):
        chart_val = self.values[i]
        if chart_val == 0:  # a bar of no height has no side to grow from: remade
            self.bars.remove(bar)
            self.bars.insert(i, self._create_bar(i, value))
            continue
        bar_lim, aligned_edge = (
            (bar.get_bottom(), DOWN) if chart_val > 0 else (bar.get_top(), UP)
        )
        quotient = value / chart_val
        if quotient < 0:
            aligned_edge = UP if chart_val > 0 else DOWN
        bar.stretch_to_fit_height(abs(quotient) * bar.height)
        bar.move_to(bar_lim, aligned_edge)
    if update_colors:
        self._update_colors()
    self.values[: len(values)] = values
    return self

SampleSpace

SampleSpaceExample
Code
import manimgx as m


class SampleSpaceExample(m.Scene):
    def construct(self) -> None:
        space = m.SampleSpace(width=6, height=5)
        space.divide_vertically(0.4, colors=[m.BLUE_E, m.GREY_BROWN])
        rain, dry = space.vertical_parts
        colors = [m.RED_E, m.TEAL_E]
        rain.add(rain.get_division_along_dimension(0.7, 1, colors, m.DOWN))
        dry.add(dry.get_division_along_dimension(0.2, 1, colors, m.DOWN))
        rain_label = m.Text("rain").next_to(rain, m.DOWN)
        dry_label = m.Text("dry").next_to(dry, m.DOWN)
        self.add(space, rain_label, dry_label)

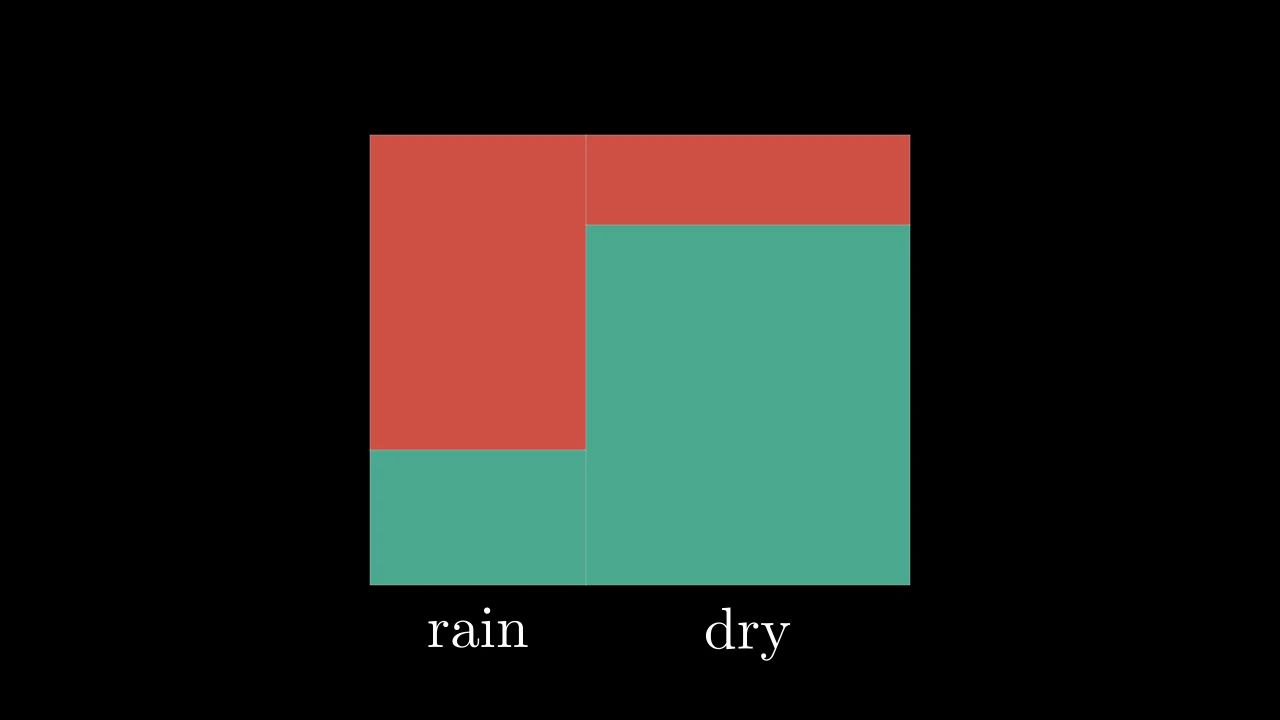
A sample space: a rectangle standing for all the outcomes, to divide into parts whose areas are probabilities; dark grey, filled, with a thin light grey outline, unless styled.

divide_vertically splits it into vertical strips, one per probability, from left to right, and keeps them as its vertical_parts; get_division_along_dimension makes the parts of a division along either side, in either direction. Each part is a sample space itself, which can be divided in turn.

m.SampleSpace(height=3, width=3, default_label_scale_val=1, **kwargs)
height

Its height, in scene units.

width

Its width, in scene units.

default_label_scale_val

Accepted for Manim compatibility; ignored.

color

The color of both fill and stroke (default white); None for the class's default.

fill_color

The fill's color; color if not given. Several colors make a gradient along sheen_direction.

fill_opacity

The fill's opacity, from 0 to 1 (default 0: no fill).

stroke_color

The stroke's color; color if not given. Several colors make a gradient.

stroke_opacity

The stroke's opacity, from 0 to 1 (default 1).

stroke_width

The stroke's width, in hundredths of a scene unit (default 4; 0: no stroke).

background_stroke_color

The color of an outline drawn behind the fill (default black).

background_stroke_opacity

The outline's opacity, from 0 to 1 (default 1).

background_stroke_width

The outline's width, in hundredths of a scene unit (default 0: none).

sheen_factor

How much the colors lighten toward sheen_direction, from -1 to 1 (default 0); a negative factor darkens.

sheen_direction

The direction the colors lighten toward (default UL).

joint_type

How the stroke is joined where its path turns: round, beveled or mitered, as a two-dimensional scene draws it (see LineJointType; default AUTO: mitered).

cap_style

How the stroke ends, at each end it shows (an open path's, a dash's): round, butt or square, as a two-dimensional scene draws it (see CapStyleType; default AUTO: butt).

shade_in_3d

Whether a three-dimensional scene's light shades the mobject.

material

How its surface reflects the scene's lights in a three-dimensional scene (see Material); None: Manim's shading (default).

name

A name for the mobject; its class's name if not given.

z_index

Its place in the drawing order: a higher index is drawn over a lower one (default 0).

target

The state MoveToTarget moves the mobject to.

It also takes the style keywords.

Source

src/manimgx/mobjects/plotting.py

def __init__(
    self,
    height: float = 3,
    width: float = 3,
    default_label_scale_val: float = 1,
    **kwargs: Unpack[Style],
):
    super().__init__(height=height, width=width, **kwargs)
    self.default_label_scale_val = default_label_scale_val

get_division_along_dimension

Make the parts that divide the sample space along a dimension, one per probability, each that fraction of it.

The parts follow one another in the direction vect, from the space's edge opposite it; they are colored along a gradient of colors, and each is a sample space itself.

sample_space.get_division_along_dimension(p_list, dim, colors, vect)
p_list

The probabilities: a part is added for the rest, if they sum to less than 1.

dim

The dimension divided: 0 for the width, 1 for the height.

colors

The colors, a gradient over the parts.

vect

The direction the parts follow one another in.

Returns A new group of the parts, not added to the space.

Source

src/manimgx/mobjects/plotting.py

def get_division_along_dimension(
    self,
    p_list: float | Iterable[float],
    dim: int,
    colors: Sequence[ParsableManimColor],
    vect: Vector3D,
) -> VGroup:
    """Make the parts that divide the sample space along a dimension, one per
    probability, each that fraction of it.

    The parts follow one another in the direction `vect`, from the space's edge
    opposite it; they are colored along a gradient of `colors`, and each is a sample
    space itself.

    Args:
        p_list: The probabilities: a part is added for the rest, if they sum to less
            than 1.
        dim: The dimension divided: 0 for the width, 1 for the height.
        colors: The colors, a gradient over the parts.
        vect: The direction the parts follow one another in.

    Returns:
        A new group of the parts, not added to the space.
    """
    p_list_complete = self.complete_p_list(p_list)
    last_point = self.get_critical_point(-vect)
    parts = VGroup()
    for factor, color in zip(
        p_list_complete, color_gradient(colors, len(p_list_complete)), strict=True
    ):
        part = SampleSpace()
        part.set_fill(color, 1)
        part.replace(self, stretch=True)
        part.stretch(factor, dim)
        part.move_to(last_point, -vect)
        last_point = part.get_critical_point(vect)
        parts.add(part)
    return parts

get_vertical_division

Make vertical strips that divide the sample space, one per probability, from left to right (see get_division_along_dimension).

sample_space.get_vertical_division(p_list, colors=(MAROON_B, YELLOW), vect=RIGHT)
p_list

The probabilities, completed to sum to 1.

colors

The colors, a gradient over the strips.

vect

The direction the strips follow one another in: RIGHT, from the left.

Returns A new group of the strips, not added to the space.

Source

src/manimgx/mobjects/plotting.py

def get_vertical_division(
    self,
    p_list: float | Iterable[float],
    colors: Sequence[ParsableManimColor] = (MAROON_B, YELLOW),
    vect: Vector3D = RIGHT,
) -> VGroup:
    """Make vertical strips that divide the sample space, one per probability, from
    left to right (see
    [get_division_along_dimension][manimgx.SampleSpace.get_division_along_dimension]).

    Args:
        p_list: The probabilities, completed to sum to 1.
        colors: The colors, a gradient over the strips.
        vect: The direction the strips follow one another in: RIGHT, from the left.

    Returns:
        A new group of the strips, not added to the space.
    """
    return self.get_division_along_dimension(p_list, 0, colors, vect)

divide_vertically

SampleSpaceDivideVerticallyExample
Code
import manimgx as m


class SampleSpaceDivideVerticallyExample(m.Scene):
    def construct(self) -> None:
        space = m.SampleSpace(width=9, height=4)
        space.divide_vertically([0.25, 0.25], colors=[m.RED_E, m.GOLD_E])
        parts = space.vertical_parts
        labels = [m.Text(n).move_to(p) for n, p in zip("ABC", parts)]
        self.add(space, *labels)

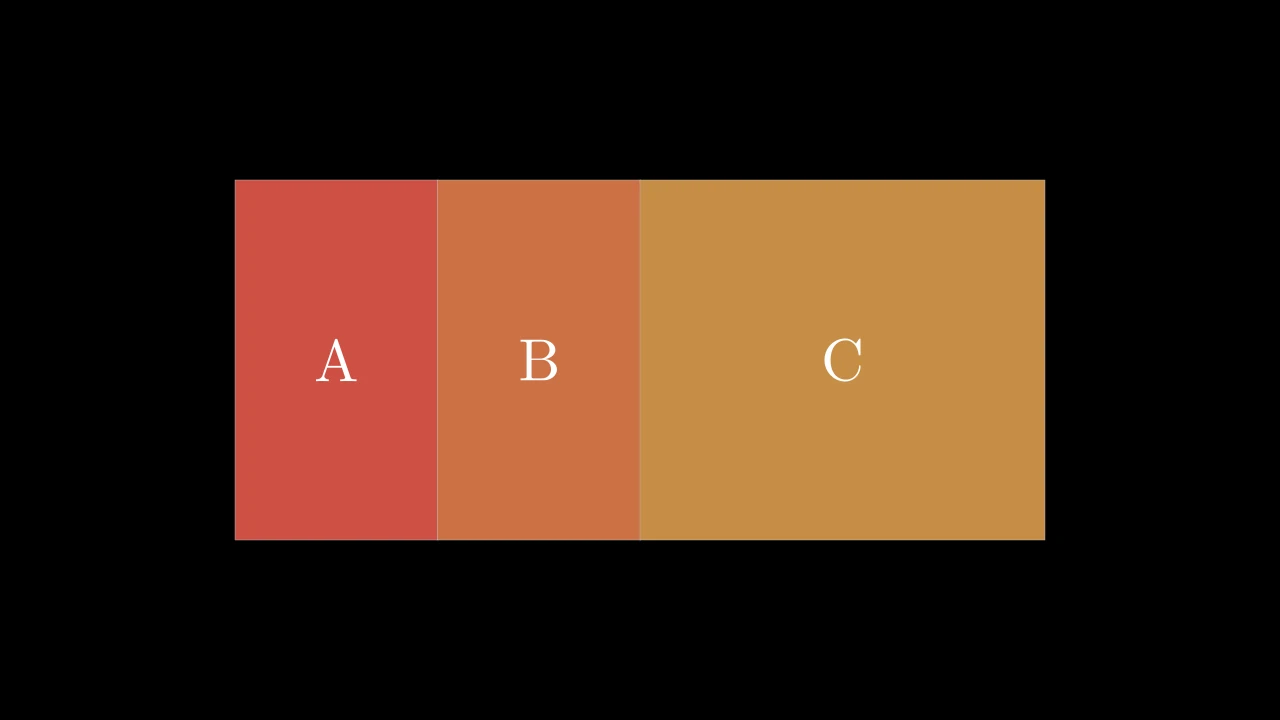
Divide the sample space into vertical strips, one per probability, from left to right: each is that fraction of its width.

The probabilities are completed to sum to 1. The strips are added to the space, as one group, and kept as its vertical_parts.

sample_space.divide_vertically(p_list, colors=(MAROON_B, YELLOW), vect=RIGHT)
p_list

A probability, or probabilities.

colors

The strips' colors: a gradient over them.

vect

The direction the strips follow one another in: RIGHT, from the left.

Source

src/manimgx/mobjects/plotting.py

def divide_vertically(
    self,
    p_list: float | Iterable[float],
    colors: Sequence[ParsableManimColor] = (MAROON_B, YELLOW),
    vect: Vector3D = RIGHT,
) -> Self:
    """Divide the sample space into vertical strips, one per probability, from left
    to right: each is that fraction of its width.

    The probabilities are completed to sum to 1. The strips are added to the space,
    as one group, and kept as its `vertical_parts`.

    Args:
        p_list: A probability, or probabilities.
        colors: The strips' colors: a gradient over them.
        vect: The direction the strips follow one another in: RIGHT, from the left.

    Examples:
        ```python
        import manimgx as m


        class SampleSpaceDivideVerticallyExample(m.Scene):
            def construct(self) -> None:
                space = m.SampleSpace(width=9, height=4)
                space.divide_vertically([0.25, 0.25], colors=[m.RED_E, m.GOLD_E])
                parts = space.vertical_parts
                labels = [m.Text(n).move_to(p) for n, p in zip("ABC", parts)]
                self.add(space, *labels)
        ```
    """
    self.vertical_parts = self.get_vertical_division(p_list, colors, vect)
    self.add(self.vertical_parts)
    return self