Graphs
Axes are a mobject with their own numbers on them. Use them to draw the graph of a function, or of data.
Axes and a graph
import manimgx as m


def square(x: float) -> float:
    return x**2


class Parabola(m.Scene):
    def construct(self) -> None:
        axes = m.Axes(x_range=[-3, 3, 1], y_range=[0, 9, 3], x_length=8, y_length=5)
        axes.add_coordinates()
        graph = axes.plot(square, color=m.BLUE)
        self.play(m.Create(axes))
        self.play(m.Create(graph))
x_range=[-3, 3, 1]puts the numbers from −3 to 3 on the x-axis, with a tick at everyy_rangedoes the same for the y-axis.x_lengthandy_lengthset how long the axes are, in units of the frame.add_coordinateswrites the numbers at the ticks.axes.plotdraws the graph of a Python function ofx.
The axes' own numbers
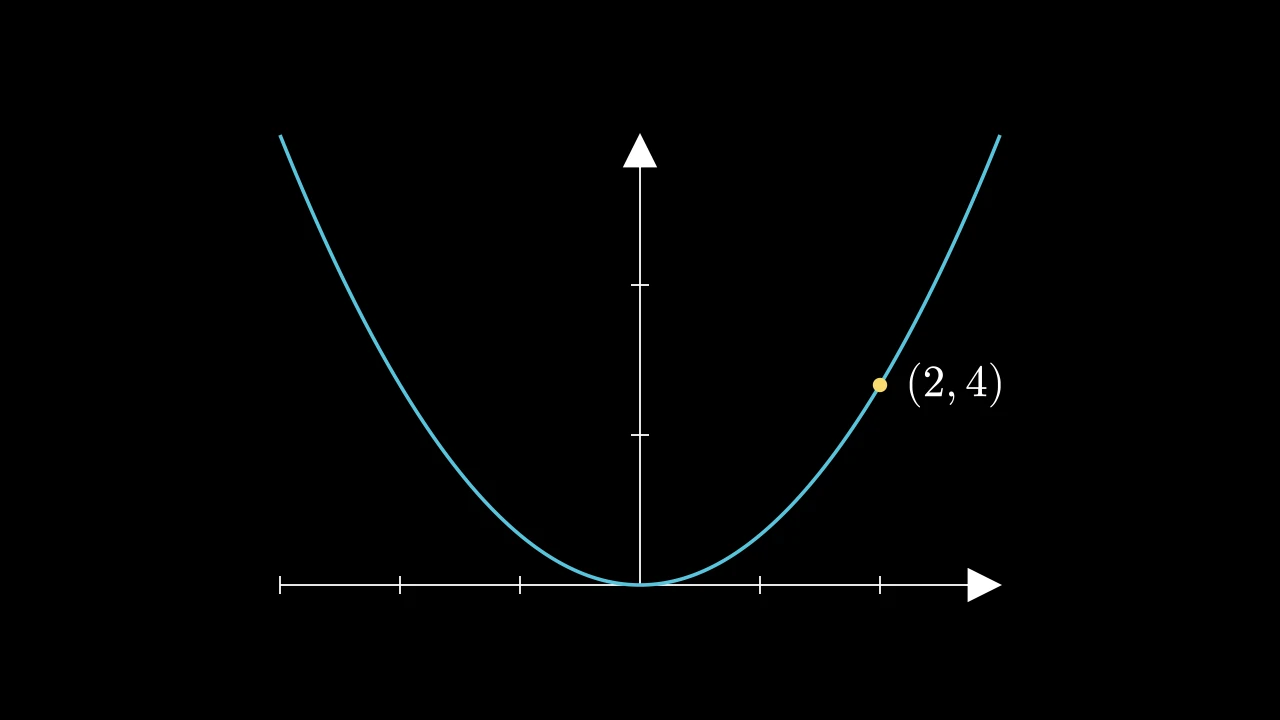
The axes have their own coordinates. On the graph above, the point where x is 2 and
y is 4 is not at [2, 4, 0] in the frame. axes.c2p(2, 4) ("coordinates to point")
gives its point in the frame. Use it to put mobjects on a graph:
import manimgx as m


def square(x: float) -> float:
    return x**2


class OnTheGraph(m.Scene):
    def construct(self) -> None:
        axes = m.Axes(x_range=[-3, 3, 1], y_range=[0, 9, 3], x_length=8, y_length=5)
        graph = axes.plot(square, color=m.BLUE)
        dot = m.Dot(axes.c2p(2, 4), color=m.YELLOW)
        label = m.MathTex("(2, 4)")
        label.next_to(dot, m.RIGHT)
        self.add(axes, graph, dot, label)
Labels and areas
The axes make the parts that explain a graph:
import manimgx as m


def curve(x: float) -> float:
    return x**2 / 4


class Area(m.Scene):
    def construct(self) -> None:
        axes = m.Axes(x_range=[0, 4, 1], y_range=[0, 4, 1], x_length=8, y_length=5.5)
        axes.add_coordinates()
        names = axes.get_axis_labels("x", "y")
        graph = axes.plot(curve, color=m.BLUE)
        label = axes.get_graph_label(graph, r"y = \frac{x^2}{4}", x_val=4)
        area = axes.get_area(graph, x_range=[1, 3], opacity=0.5)
        self.play(m.Create(axes), m.Write(names))
        self.play(m.Create(graph), m.Write(label))
        self.play(m.FadeIn(area))
        self.wait()
get_axis_labelsnames the axes.get_graph_labelwrites a label, in LaTeX, at the end of a graph, or atx_val.get_areafills the area under a graph, between two values ofx.
These methods make new mobjects. Add them to the scene, or animate them, as the example does.
m.NumberPlane(), the grid of Positions, is axes too: axes that fill the
frame, with the frame's own coordinates. The plotting reference
shows every kind of axes and graph.
Next
Updaters shows how to make a mobject follow another, such as a dot that moves along a graph.